
Overview
This use case analyses the business cycle by separating the long-run trend of a macroeconomic or market series from its cyclical component. The workflow compares several filtering techniques, including Hamilton and Hodrick-Prescott style methods, to estimate the underlying trend while preserving the short-run fluctuations that matter for macroeconomic monitoring.
The practical objective is to identify expansions, slowdowns and turning points without relying only on raw data. Different filters react differently to shocks and end-of-sample observations, so the workflow also evaluates their statistical behaviour and compares one-sided versus two-sided estimates. This is especially important when the analysis is used in real time, where future observations are not yet available.
Business relevance
- Separate structural growth from temporary cyclical fluctuations in macroeconomic and market series.
- Detect turning points and regime changes earlier for strategic planning and risk management.
- Compare real-time one-sided estimates with ex-post two-sided filters to understand revision risk.
- Support macro scenario design, asset-allocation decisions and corporate planning.
- Choose the filtering method that provides the best balance between smoothness, responsiveness and statistical stability.
Solution
The solution is to use a filter-comparison framework rather than relying on a single business-cycle estimate. Figure 1 shows why this matters. The Hamilton trend broadly follows the long-run path of the original series while allowing sharp deviations during stress periods, whereas the HP one-sided and two-sided trends are close over most of the sample but diverge around major turning points. That gap is revision risk: the real-time one-sided estimate cannot use future data, while the two-sided estimate can revise the historical trend once more observations arrive.
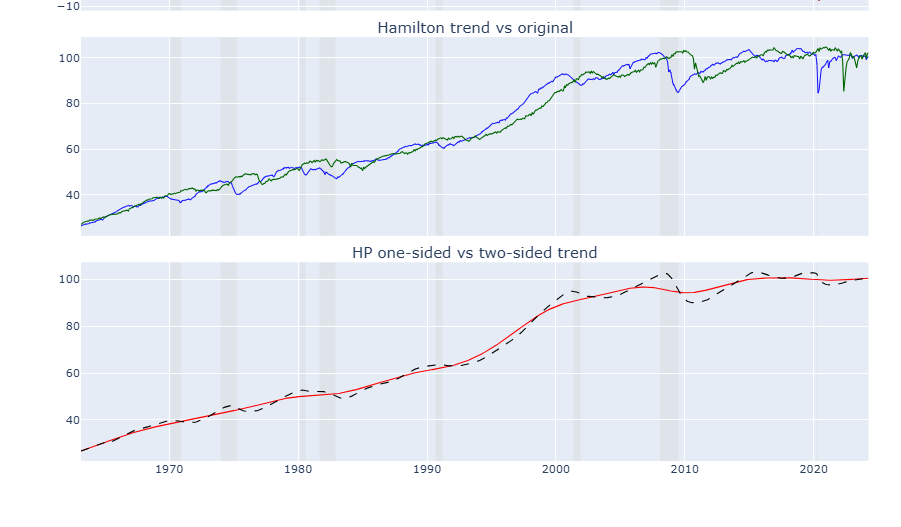
Figure 2 quantifies the trade-off between methods. The HP filters generate cycle amplitudes around 2.3 with high positive skewness and very large kurtosis, showing that the extracted cycle contains infrequent but extreme shocks. BK and CF produce substantially lower standard deviation and amplitude but even more extreme kurtosis, while Hamilton produces the largest standard deviation and amplitude but a much lower kurtosis, indicating a broader and less spike-dominated cyclical signal.
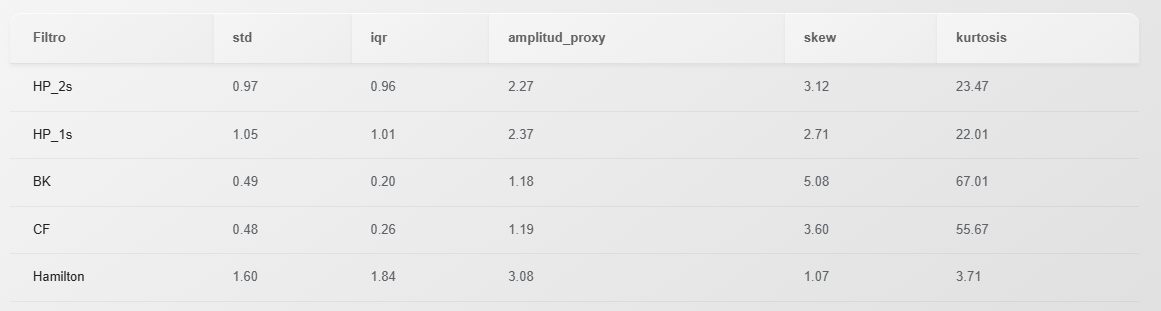
Together, the two graphics provide a practical macro decision framework. Figure 1 shows how quickly each method reacts to changes in the underlying series; Figure 2 shows the statistical character of the cycle each method produces. For real-time monitoring, one-sided filters or Hamilton-style estimates can be prioritised because they avoid look-ahead information. For historical decomposition and research, two-sided filters can provide a smoother ex-post view. The result is a more robust way to detect expansions, slowdowns and turning points while explicitly managing the risk that the estimated cycle changes as new data arrive.