
Overview
This use case analyses an insurance portfolio through a Solvency II lens, with particular focus on Best Estimate Liabilities (BEL), approximate Solvency Capital Requirement (SCR) and how both metrics behave across groups of contracts (GOCs). The workflow converts cash-flow and valuation information into a portfolio view and then decomposes the result by GOC, allowing the user to see which blocks of business drive liability magnitude, capital consumption and sensitivity to interest-rate shocks.
Rather than stopping at a single portfolio number, the analysis shows how BEL and SCR are distributed across individual cohorts. It also compares a base valuation against a +100bp stressed interest-rate scenario. This makes the use case highly practical for insurers that need to understand where solvency risk is concentrated, which GOCs are most sensitive to market movements and where management action should be prioritised.
Business relevance
- Decompose BEL and solvency impact by GOC instead of relying only on portfolio totals.
- Identify which cohorts consume the most SCR and therefore deserve the greatest management attention.
- Stress-test the portfolio under interest-rate shocks to assess sensitivity of liabilities.
- Support Solvency II monitoring, risk committees and capital planning with interpretable visual evidence.
- Create a more decision-ready bridge between actuarial output and management action.
Solution
Solution
The solution is to use this GOC-level solvency workflow as a monitoring and decision engine for insurance balance-sheet risk. Figure 1 immediately reveals that approximate SCR is not evenly spread across the portfolio. A small number of GOCs dominate capital usage, while several others contribute only marginally and a few even show offsetting effects. This is operationally important: instead of treating the portfolio as homogeneous, management can identify the specific cohorts that drive most of the solvency burden.
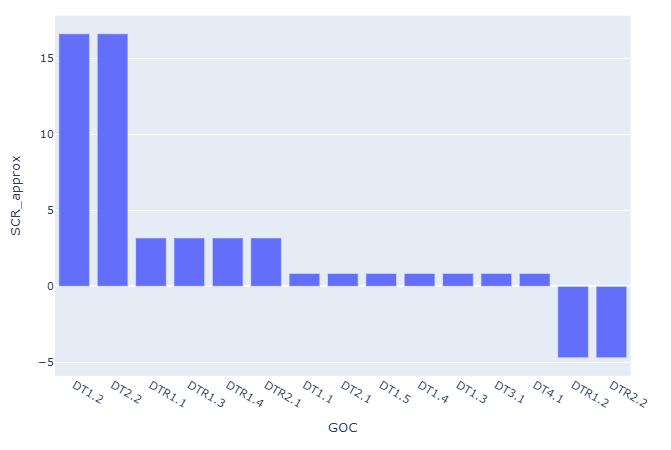
Figure 2 complements that capital view with the liability view. The BEL bars show that the largest and most negative liability positions are concentrated in a limited set of GOCs, especially the two largest blocks on the right-hand side of the chart. Comparing BEL_base with BEL_p100bp shows how much each cohort moves under an upward rate shock. Where the bars hardly change, the cohort is relatively insensitive; where the stressed BEL diverges more visibly from the base BEL, interest-rate sensitivity is economically more material.
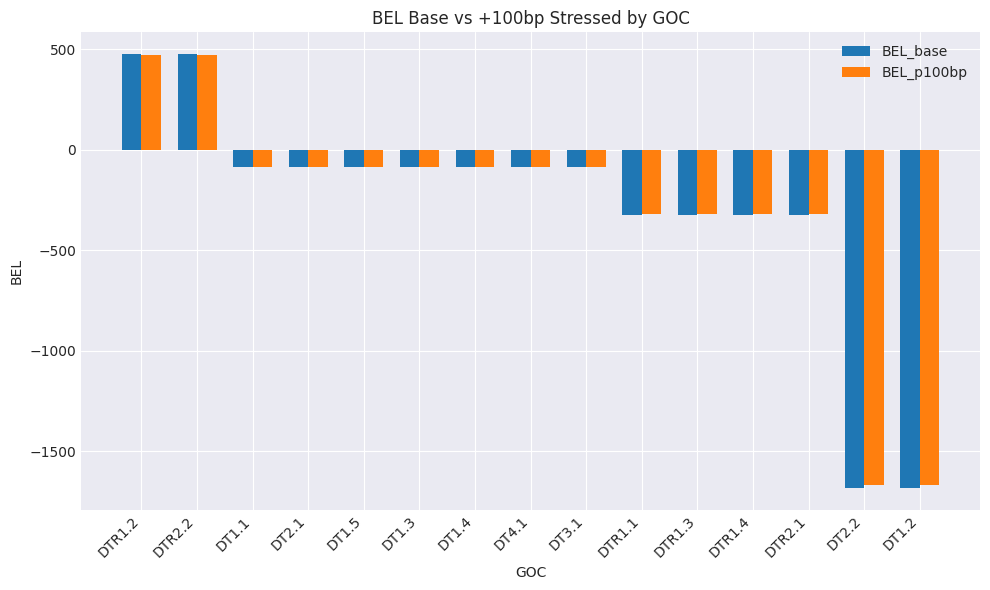
Taken together, the two charts provide a directly actionable solution. Figure 1 tells us where capital pressure sits; Figure 2 tells us which GOCs are responsible for the deepest liability positions and how they react to higher rates. That means the insurer can prioritise the GOCs that combine large negative BEL with high SCR contribution, review product design or assumptions for those blocks, refine hedging or asset-liability management around rate-sensitive cohorts, and improve solvency steering at both portfolio and cohort level.