
Overview
The Lee-Carter mortality model is a widely used actuarial framework for analysing how mortality rates evolve across age and time. It separates the historical mortality surface into an age-specific component, a time-varying mortality index and an age-dependent sensitivity term. This makes it possible to identify the long-term direction of mortality improvement, quantify which ages react most strongly to those changes, and project future mortality patterns in a structured and interpretable way.
In an insurance context, the model supports life insurance pricing, annuity valuation, pension and longevity-risk analysis, capital planning and actuarial scenario generation. The selected outputs below show two complementary views of the analysis: observed mortality curves by age for different years, and the Lee-Carter bx parameter, which measures how sensitive mortality at each age is to changes in the common time trend. Together, they provide an intuitive view of both the raw demographic pattern and the structure captured by the model.
Business relevance
- Forecast future mortality and longevity trends using historical population data.
- Support pricing and reserving decisions for life insurance and annuity portfolios.
- Measure age-specific exposure to systematic mortality improvement.
- Create actuarial scenarios for capital, solvency and portfolio risk management.
- Solution
Solution
The practical solution is to use the Lee-Carter model as a mortality-forecasting layer for insurance and actuarial decision-making. Figure 1 shows how mortality varies by age across selected years: the separation between the curves reveals that mortality is not static and that the change is especially material at older ages. This gives actuaries a direct empirical basis for adjusting longevity assumptions instead of relying on a single fixed mortality table.
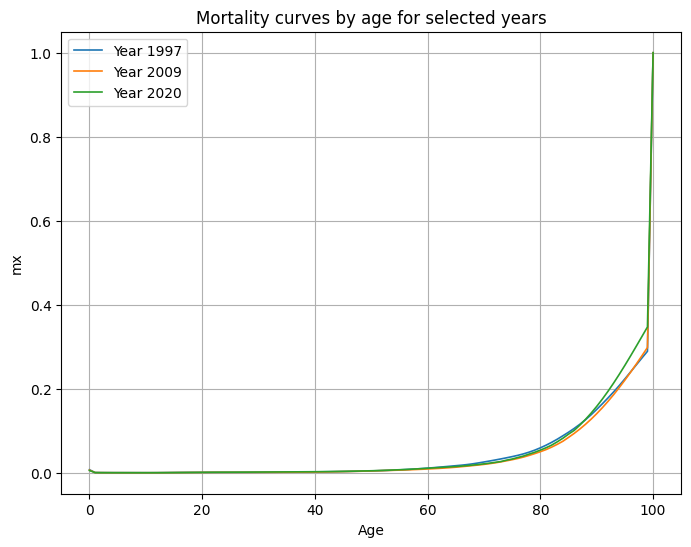
Figure 2 explains where those changes matter most. The Lee-Carter bx curve measures the sensitivity of mortality at each age to the common time trend; ages with larger positive bx values react more strongly when the mortality index changes, while low or negative values are less sensitive. Combining both graphics allows an insurer to translate observed demographic change into age-specific model sensitivity, improving mortality projections, annuity and life-pricing assumptions, reserving, longevity-risk measurement and stress scenarios.
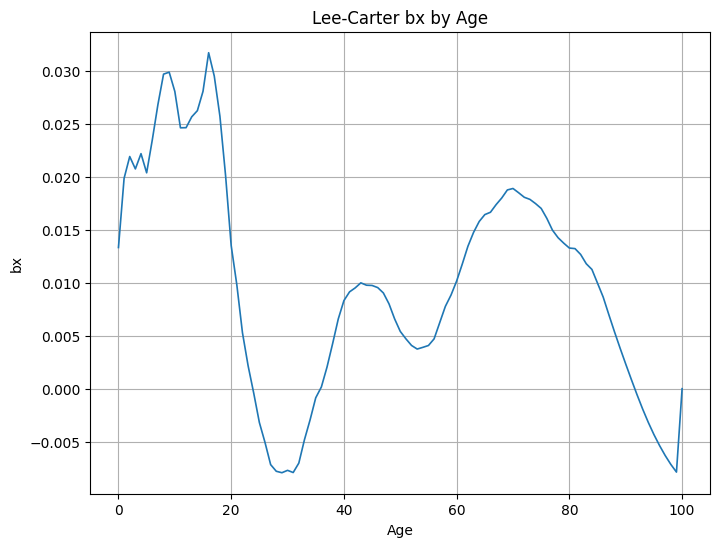
In operational terms, the analysis turns historical mortality data into a forward-looking actuarial input: the first chart validates the real-world age pattern, while the second identifies how the model distributes systematic mortality improvement across ages. The resulting forecasts can then be fed directly into pricing, valuation, solvency and portfolio-risk processes.