
Overview
This use case analyses a life-insurance portfolio with the objective of reducing a large book of policies into a smaller, representative set while preserving the economic and actuarial characteristics that matter for valuation and risk. The workflow explores the distribution of key liability metrics, identifies extreme or atypical policies, studies dependencies between premiums, benefits, duration, best-estimate liabilities and projected net cash flows, and uses that structure to guide portfolio compression.
The business problem is computational as much as actuarial. Large portfolios can contain thousands or millions of contracts, making repeated valuation, scenario analysis and stress testing expensive. A well-designed compressed portfolio retains the main risk drivers and cash-flow behaviour of the original book, allowing faster calculations without losing the information required for capital, ALM, solvency and management analysis.
Business relevance
- Reduce the computational cost of large-scale life-insurance valuation and stress testing.
- Identify outlier policies that could distort a representative compressed portfolio.
- Preserve the main dependencies between premiums, benefits, BEL and projected net cash flows.
- Support faster Solvency II, ALM and scenario calculations using representative policies.
- Improve model governance by making the compression process data-driven and auditable.
Solution
Solution
The solution is to compress the portfolio only after identifying the variables and contracts that carry the most economic information. Figure 1 shows why a simple average-policy approach would be unsafe. RF_PM0 has a strongly skewed distribution with a large number of high-value outliers, including contracts far above the central range of the portfolio. Those policies cannot be treated as ordinary observations: they may represent disproportionate premium, liability or cash-flow exposure and therefore need to be retained explicitly or given greater weight when representative clusters are constructed.
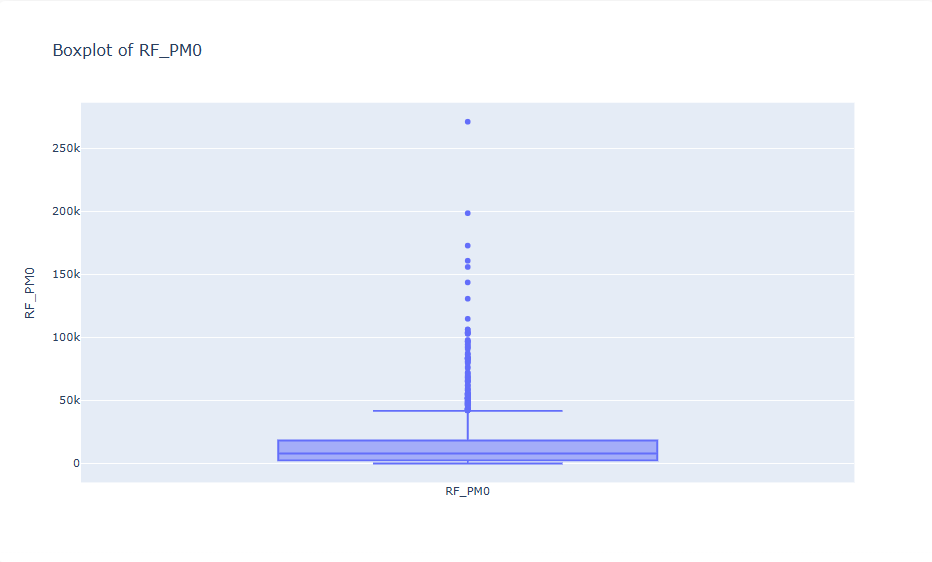
Figure 2 provides the second half of the compression logic. The correlation heatmap shows that many projected net-cash-flow variables across years move together very strongly, while several liability and premium variables also exhibit clear positive or negative relationships. This means the portfolio contains substantial redundancy: a smaller set of carefully chosen features and representative policies can preserve much of the original risk structure. At the same time, variables with weaker or opposite relationships must remain visible so that the compressed book does not collapse distinct economic behaviours into a single profile.
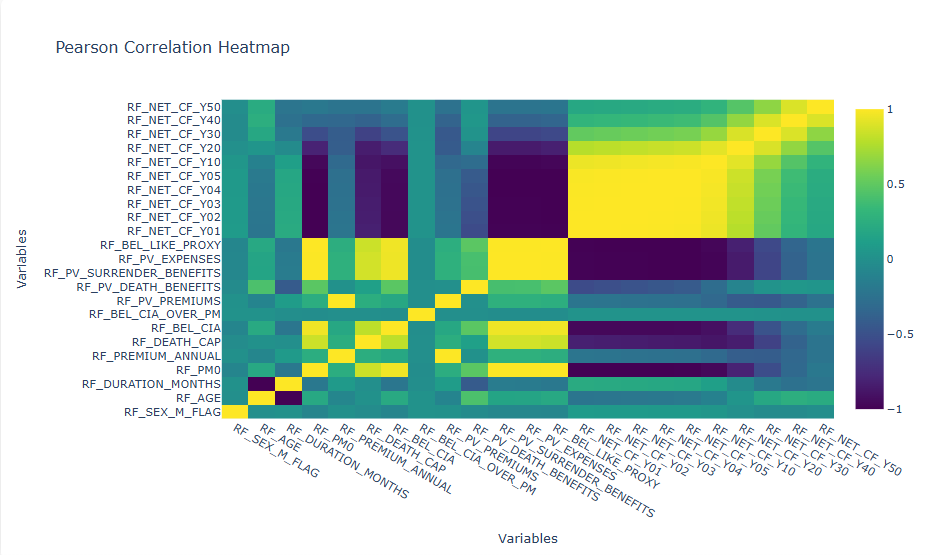
Taken together, the charts define a practical compression strategy. Figure 1 identifies the tail contracts that should not be lost during sampling; Figure 2 identifies the correlated blocks of information that can be represented more efficiently. The insurer can therefore cluster policies on the main actuarial risk dimensions, preserve extreme contracts separately, assign weights to representative policies and validate the compressed portfolio by comparing BEL, premiums and projected cash flows against the full book. The result is a much smaller portfolio that can be valued and stressed faster while remaining economically faithful to the original exposure.