
Overview
This use case analyses hurricane risk using historical storm data, focusing on the frequency and intensity structure of events. The workflow examines core meteorological indicators such as minimum pressure, category classification and their behaviour through time. Instead of looking only at isolated extreme events, the case builds an empirical view of how often storms occur, how intense they tend to be and what the overall distribution of hurricane characteristics looks like.
For insurers, reinsurers and catastrophe-risk teams, this matters because hurricane exposure is driven by both event count and event severity. A portfolio can be damaged either by a small number of very intense events or by a high number of moderate storms affecting exposed regions. This type of analysis therefore provides the first layer of catastrophe intelligence needed for pricing, underwriting, reinsurance design and capital management.
Business relevance
- Measure the historical frequency of storm categories and identify the dominant event types.
- Understand the distribution of minimum pressure as a proxy for storm intensity.
- Support catastrophe pricing, underwriting limits and exposure accumulation analysis.
- Improve reinsurance structuring by linking frequency and severity patterns to portfolio risk.
- Provide an interpretable basis for catastrophe monitoring and climate-related risk discussion.
Solution
Solution
The solution is to use this hurricane-risk workflow as an early catastrophe intelligence layer for insurance decision-making. Figure 1 shows the distribution of minimum pressure, which is one of the clearest indicators of storm intensity. The mass of the distribution is concentrated in the higher-pressure range, while a thinner left tail captures the more intense storms with lower minimum pressure. This tells us that extreme hurricanes are relatively less frequent, but they are precisely the events that can generate the most severe insured losses. The graph therefore helps separate the normal event regime from the extreme tail that must drive stress testing and reinsurance thinking.
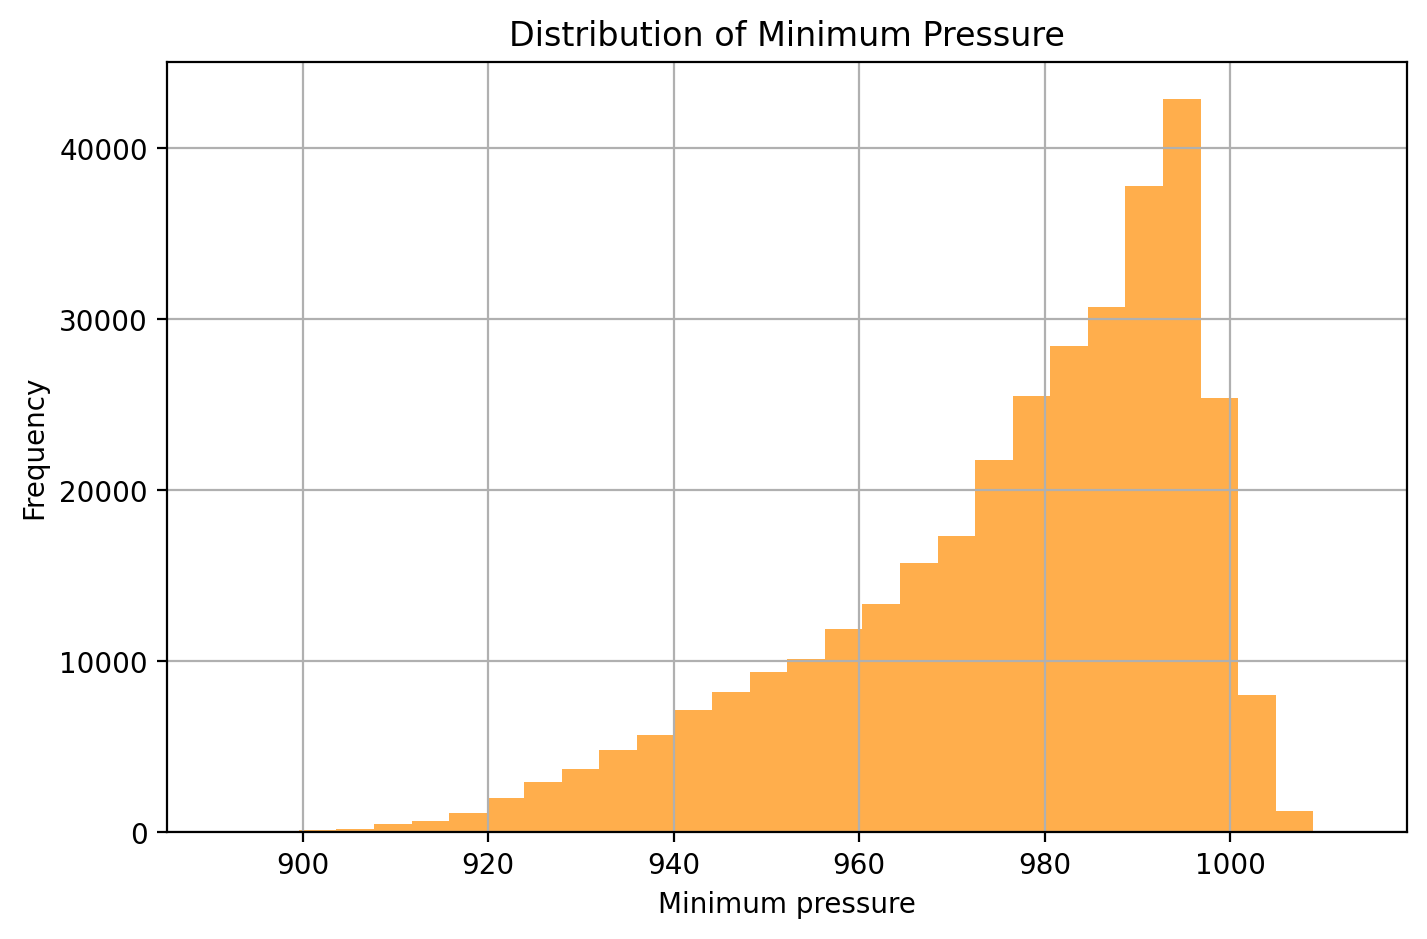
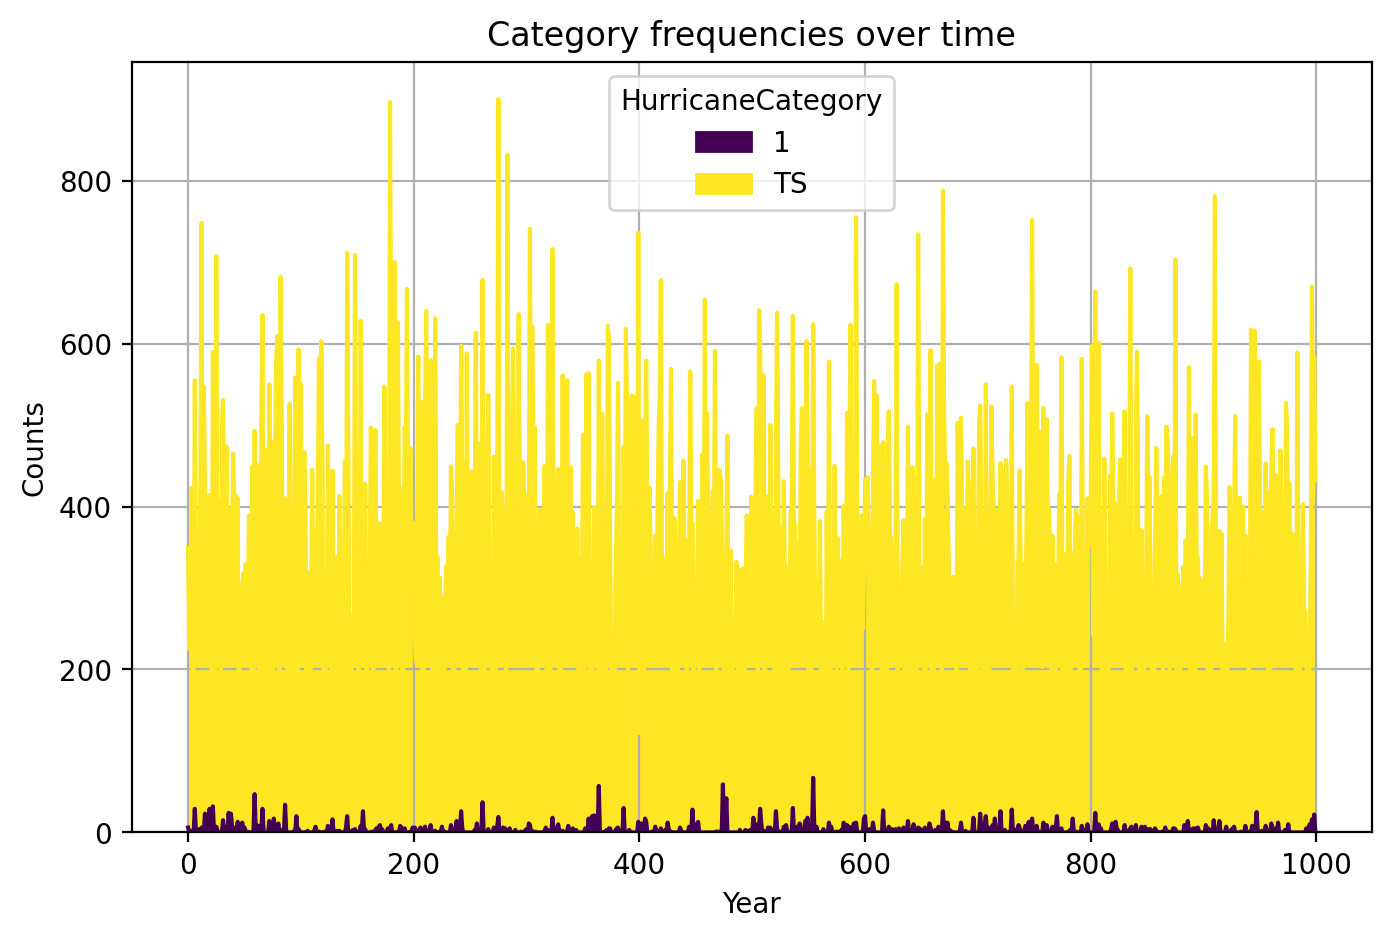
Figure 2 adds the frequency dimension. It shows that tropical storms dominate the historical event count, while Category 1 hurricanes appear much less often. This is important because catastrophe risk is not only about severity but also about repetition. A portfolio with broad geographic exposure may absorb repeated loss activity from numerous lower-category events even if only a few storms reach severe intensity. The chart therefore helps quantify which event classes are the main drivers of operational activity and which are the main drivers of capital stress.
Taken together, the two charts support a practical solution: combine the intensity profile from Figure 1 with the event-frequency profile from Figure 2 to create more disciplined catastrophe pricing, concentration limits and reinsurance strategy. Frequent lower-intensity storms inform attritional catastrophe expectations, while rare low-pressure extremes inform tail-risk protection and solvency stress. That gives insurers and reinsurers a clearer basis for setting underwriting appetite, reviewing coastal exposure, designing catastrophe covers and communicating hurricane risk in a way that is directly tied to observed data.