
Overview
This use case extends hurricane analytics into a catastrophe-risk setting by introducing spatial analysis of storm trajectories and landfall behaviour, with a particular focus on Florida. The objective is not only to measure storm intensity or event frequency, but to understand where hurricane activity reaches land, which coastal areas are most exposed and how geographic concentration can amplify insured losses.
For insurers and reinsurers, this is critical because catastrophe losses depend on the interaction between hazard and exposure. A storm only becomes an economic loss event when its path intersects insured assets. By mapping tracks and landfall locations, the workflow provides a more operational view of catastrophe risk: which geographies are repeatedly threatened, where exposure accumulations may be too high and where pricing, underwriting or reinsurance protection should be tightened.
Business relevance
- Map where hurricane hazard interacts with insured exposure rather than analysing storms only in aggregate.
- Identify geographic concentration of landfall risk in Florida and surrounding coastal areas.
- Support catastrophe pricing, underwriting appetite and coastal concentration management.
- Improve reinsurance design by highlighting the zones where tail losses are most likely to materialise.
- Provide an evidence-based foundation for catastrophe accumulation monitoring and regional stress testing.
Solution
Solution
The solution is to use this spatial catastrophe workflow as a geographic risk-allocation tool. Figure 1 provides the hazard map: it places hurricane activity in physical space and shows how storm tracks approach the Florida region. Even before combining the analysis with portfolio data, the map frames the core catastrophe question correctly: risk is path-dependent, not just event-dependent. A coastal insurer does not face the same hurricane risk everywhere, because the economic impact depends on where tracks concentrate and how those paths intersect insured assets.
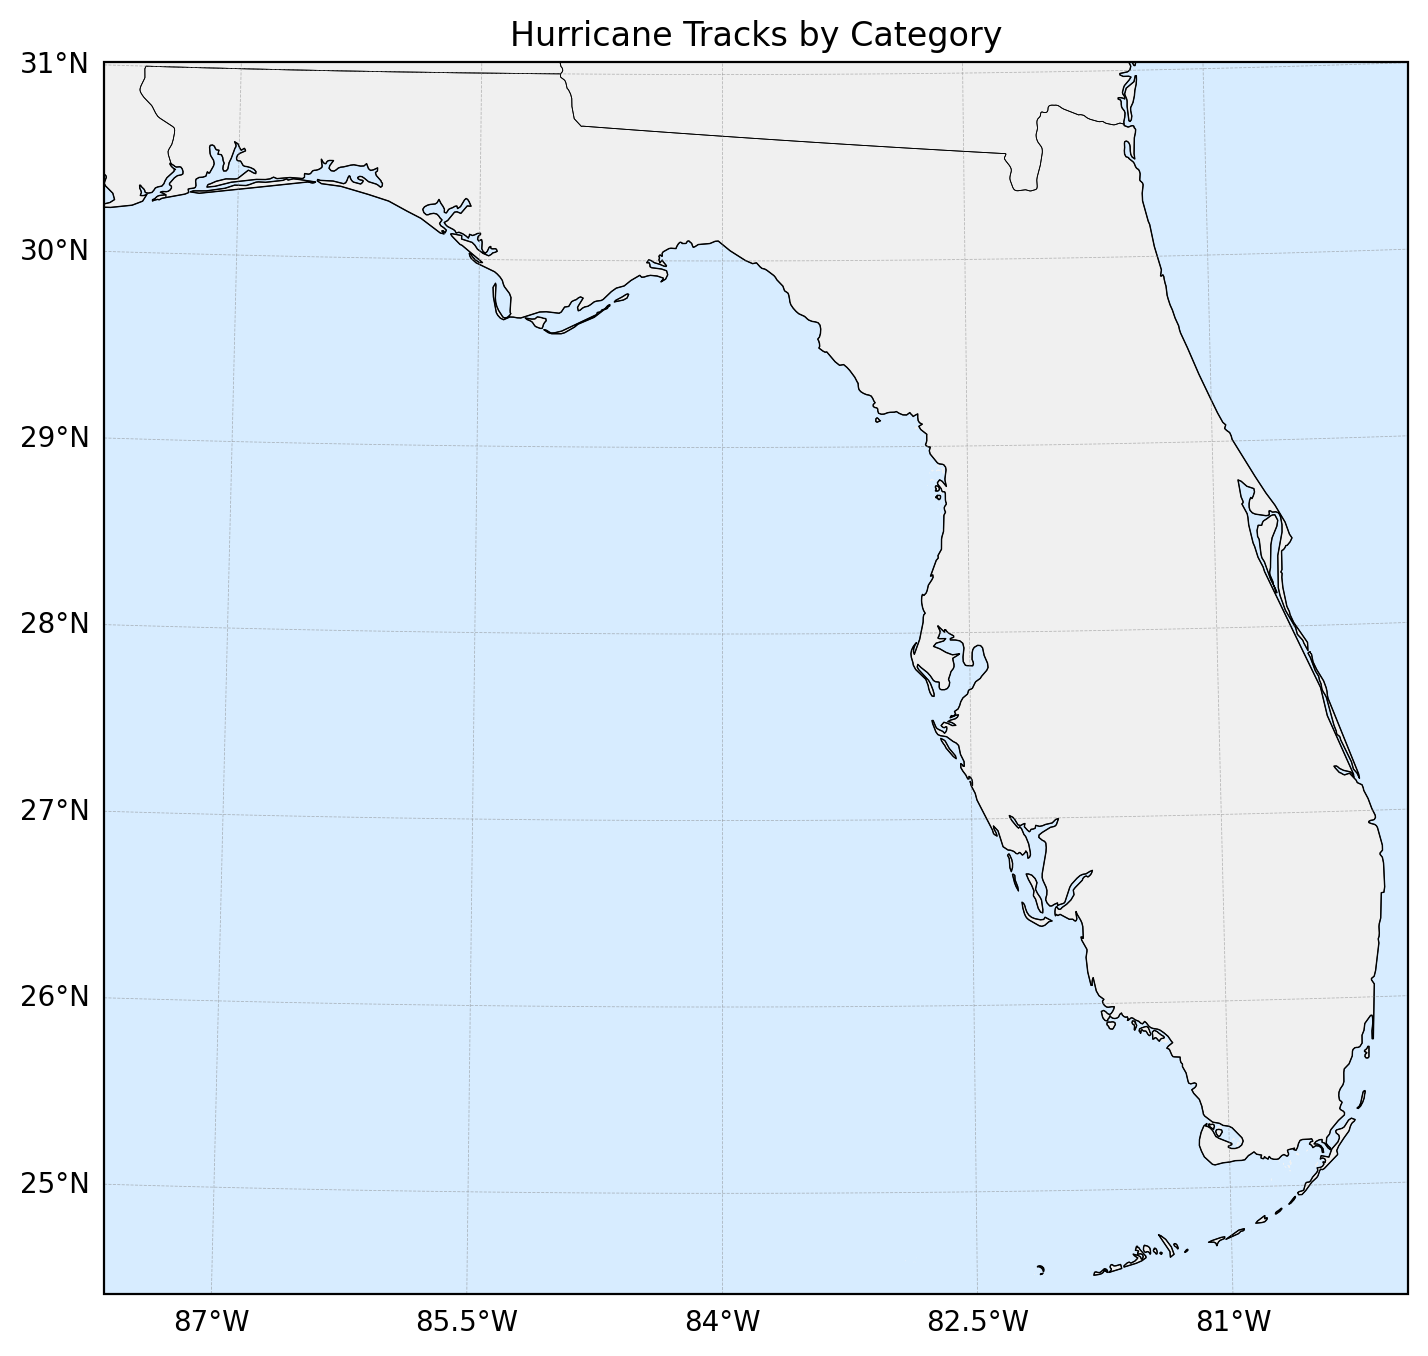
Figure 2 turns that hazard view into a more operational exposure view. The landfall-point map highlights how widely Florida can be affected and how landfall risk is distributed across the state. Rather than a single isolated hotspot, the visual suggests a broad geographic footprint of potential impact, meaning catastrophe exposure must be managed as a statewide and coastal accumulation problem. This is highly relevant for homeowners, commercial property and specialty insurers with large books in Florida.
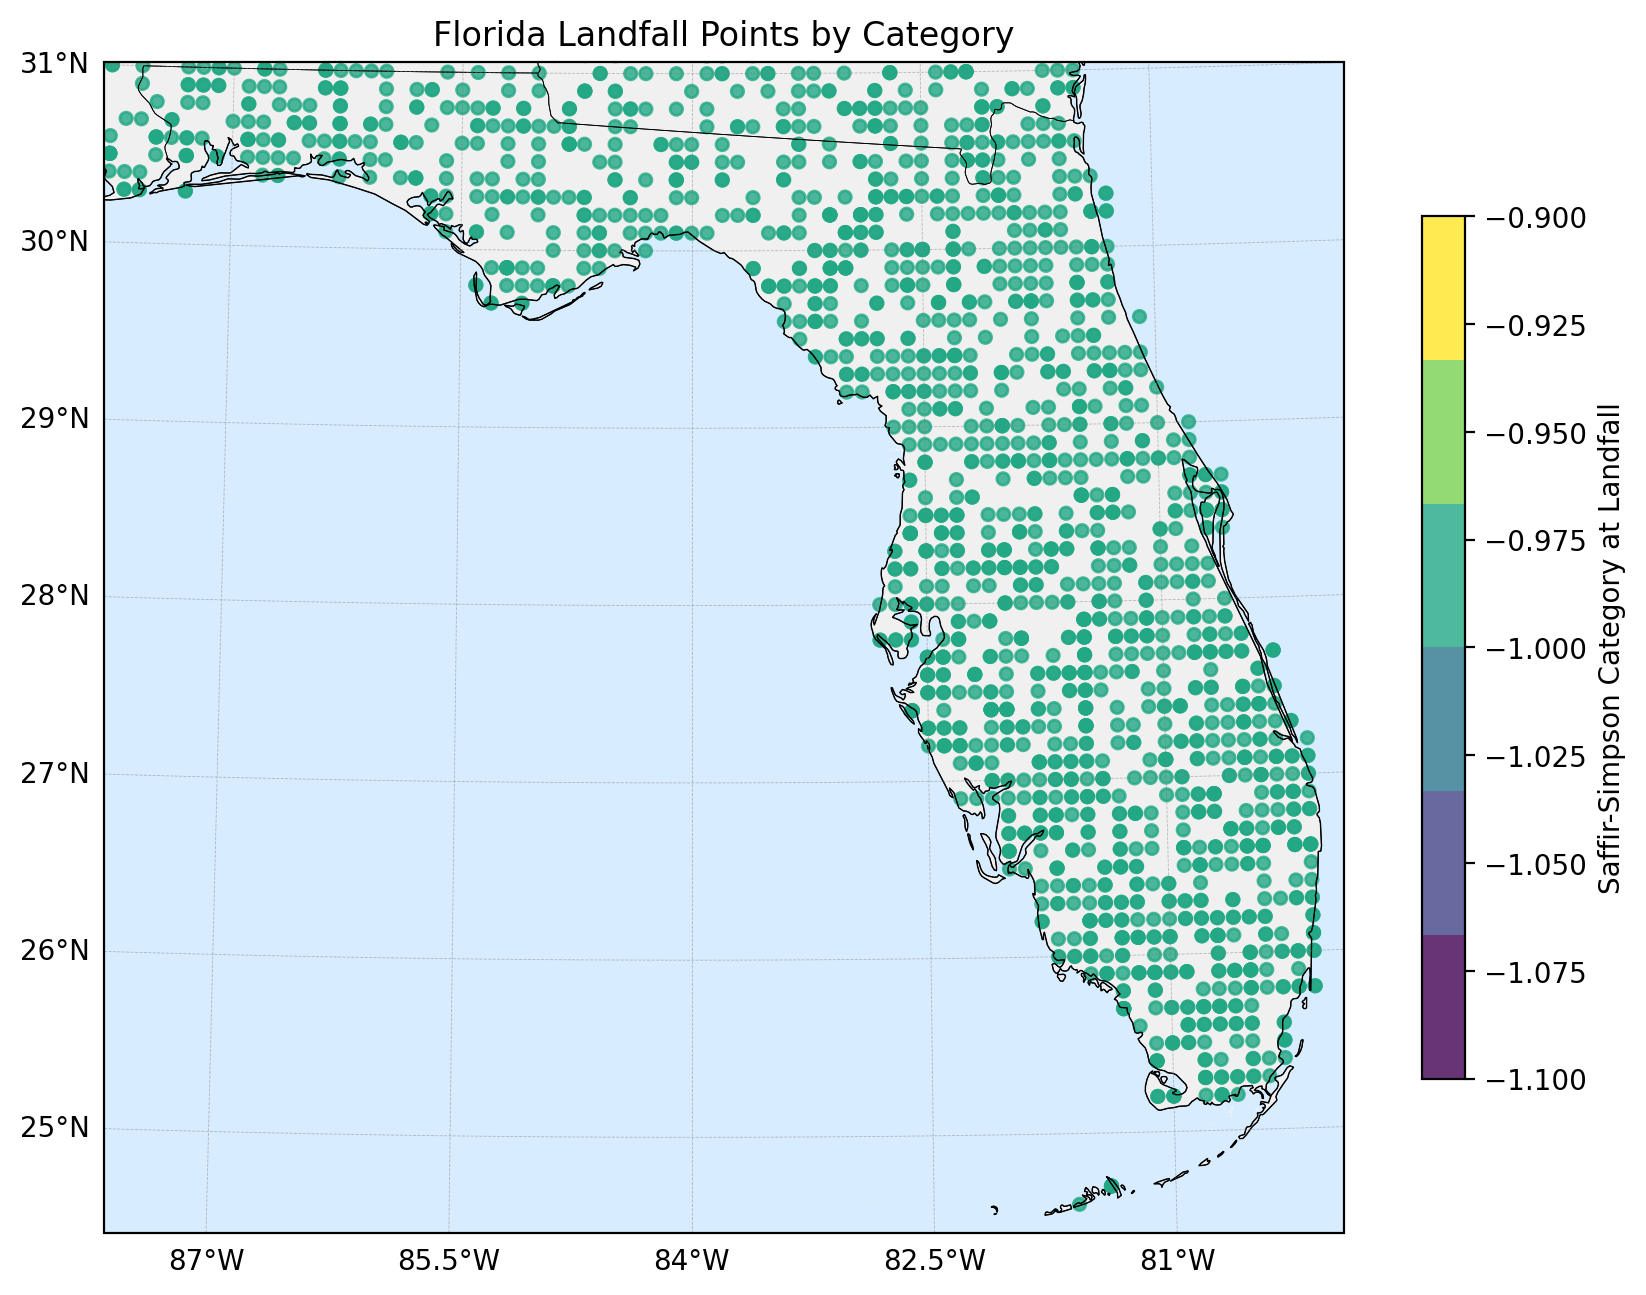
Taken together, the two figures support a practical catastrophe-risk solution. Figure 1 explains where the storm hazard comes from; Figure 2 shows where that hazard can translate into landfall exposure. This allows the insurer or reinsurer to overlay its own portfolio, identify concentration pockets, adjust underwriting appetite in high-risk zones, price coastal policies more consistently and design reinsurance around the areas most exposed to severe landfall events. In other words, the graphics transform hurricane analytics into a directly usable framework for accumulation control, capital protection and catastrophe decision-making.