
Overview
This use case builds a complete Value at Risk (VaR) backtesting framework using S&P 500 market data. The workflow starts from historical prices, converts them into daily log-returns and uses those returns to estimate the distribution of potential losses. The resulting VaR forecasts are then compared with realised outcomes to determine whether the model is producing an appropriate number of breaches and whether its risk estimates remain reliable through changing market regimes.
Backtesting is essential because a VaR number is only useful if its predicted tail frequency is consistent with what actually occurs. A model that produces too many exceptions is underestimating risk; one that almost never breaches may be excessively conservative. The framework therefore combines historical market behaviour with statistical validation so that risk teams can monitor model performance rather than treating VaR as a static daily metric.
Business relevance
- Validate whether market-risk VaR forecasts are consistent with realised losses.
- Detect underestimation of risk through an excessive number of VaR exceptions.
- Identify periods of volatility clustering and market stress that challenge model assumptions.
- Support regulatory market-risk controls, model validation and internal risk limits.
- Provide an auditable framework for deciding when VaR parameters or methodology need recalibration.
Solution
The solution is to use the historical price series and the return distribution together as the foundation for a continuously validated VaR engine. Figure 1 shows that the S&P 500 has experienced very different market regimes across time, including prolonged expansions, sharp drawdowns and rapid recoveries. A risk model calibrated in one regime cannot be assumed to remain equally accurate in another, which is why VaR must be tested against realised performance rather than accepted at face value.
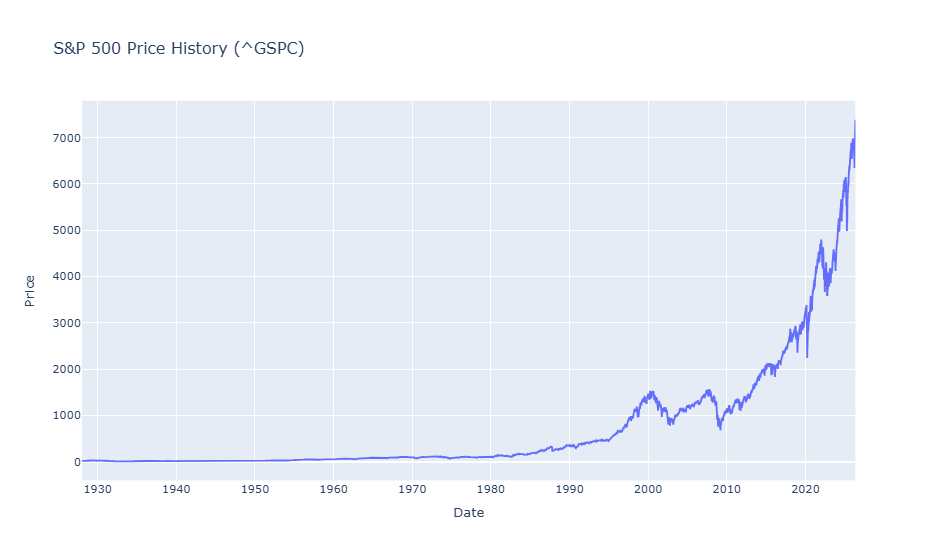
Figure 2 explains where the validation pressure comes from. Daily log-returns are centred near zero most of the time, but the series contains clear volatility clustering and large tail events, including the extreme moves around the 1987 crash. These observations are precisely the periods most likely to generate VaR breaches. If the model consistently misses such events or produces clusters of exceptions, the backtest signals that volatility, distributional assumptions or lookback windows need to be recalibrated.
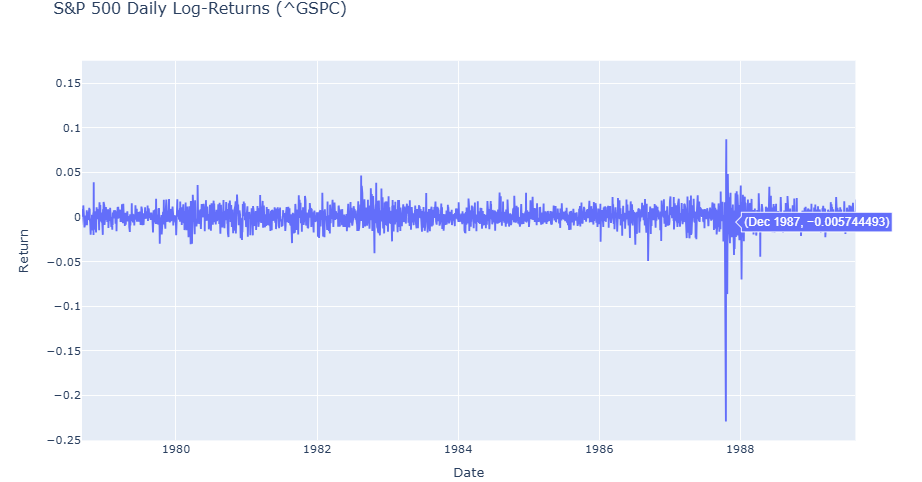
Together, the two charts provide the operational logic for market-risk control. Figure 1 identifies the regime context in which the model is operating; Figure 2 shows the actual loss dynamics the VaR engine must capture. The bank can then compare predicted VaR with realised P&L, count exceptions, run statistical coverage tests and escalate the model when breaches exceed the expected frequency. This turns VaR from a reporting number into a monitored risk system with explicit evidence of whether it is working.