
Overview
This use case analyses concentration risk in a credit portfolio by studying how total exposure is distributed across individual obligors. The objective is to identify whether portfolio risk is broadly diversified or whether a small number of names represent a disproportionate share of exposure. The workflow combines distribution analysis with a direct ranking of the largest obligors, making concentration visible both statistically and operationally.
Concentration risk matters because a portfolio can look diversified by number of counterparties while still being economically dependent on only a handful of large exposures. A default or deterioration in one of those names can therefore generate losses far larger than suggested by an average-exposure view. This analysis provides a practical layer for limit setting, portfolio steering, stress testing and capital allocation.
Business relevance
- Detect whether portfolio exposure is dominated by a small number of obligors.
- Identify the single names that should receive the highest monitoring priority.
- Support large-exposure limits, diversification targets and credit committee decisions.
- Improve stress testing by focusing scenarios on economically material concentrations.
- Provide a transparent basis for portfolio rebalancing and concentration-risk capital.
Solution
The solution is to use the exposure distribution and the top-name ranking together as a concentration-control framework. Figure 1 shows a strongly right-skewed portfolio: most obligors have relatively small exposures, while a thin tail extends toward very large positions. Average exposure is therefore not representative of the portfolio; the economic risk is concentrated in a small number of names sitting far out in the right tail.
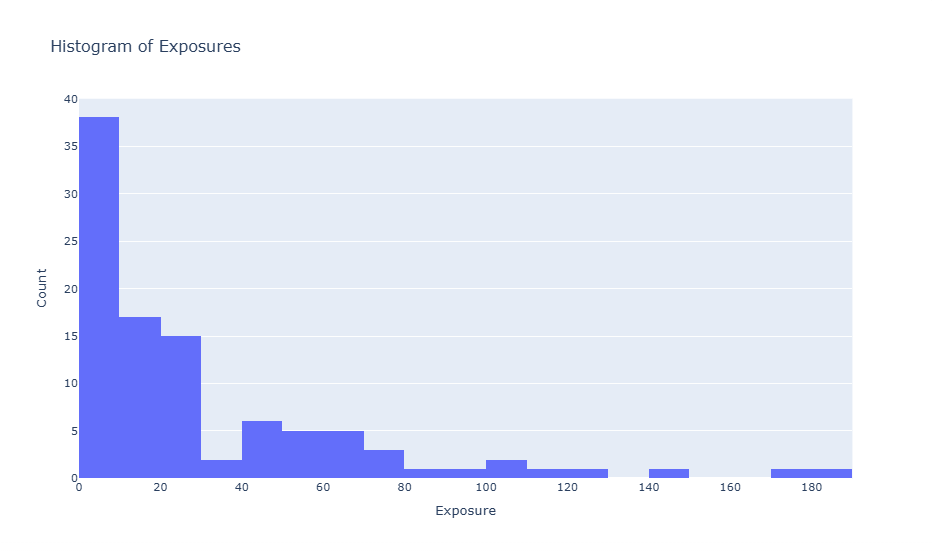
Figure 2 identifies those names explicitly. The largest obligor exposure is approximately 185, followed by another near 175 and several positions above roughly 100-150. These names should drive the first layer of monitoring because a deterioration in one of them would have a much larger portfolio impact than a default among the many small exposures.
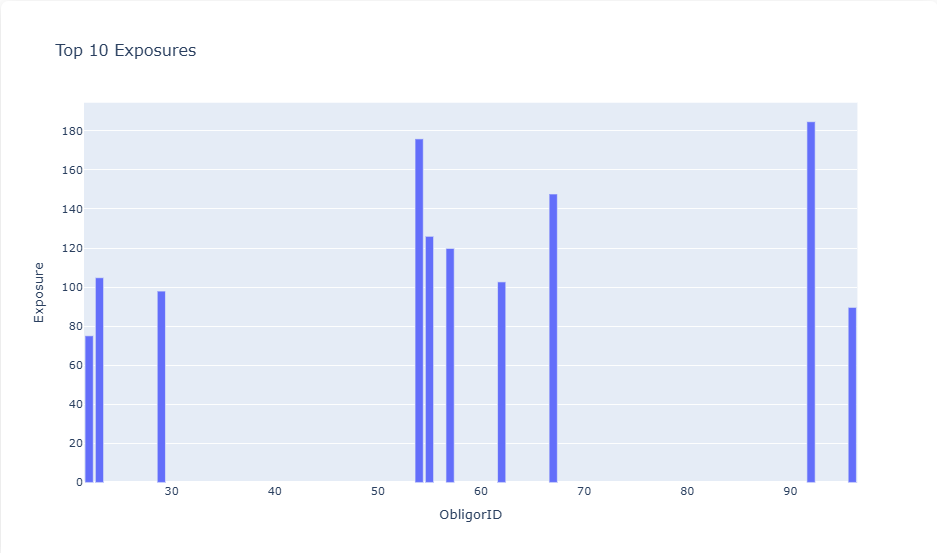
Together, the charts translate concentration risk into action. Figure 1 confirms the long-tail structure; Figure 2 identifies the obligors creating it. The institution can set tighter single-name limits, require additional approval for further exposure increases, run targeted downgrade/default stresses and rebalance the book when a name exceeds the desired concentration threshold.