
Overview
This use case applies the Fundamental Review of the Trading Book (FRTB) framework to General Interest Rate Risk (GIRR) delta exposures. The workflow calculates bucket-level market-risk capital and then tests how the capital requirement changes after an optimisation or hedging step. Instead of looking only at total portfolio capital, the analysis decomposes the requirement by GIRR bucket so that the main drivers of regulatory market-risk capital are visible.
This is useful for trading and treasury portfolios because GIRR capital can be highly concentrated in a small number of tenor or currency buckets. An optimisation process can therefore focus on the exposures that generate the largest marginal capital benefit rather than applying hedges uniformly across the book.
Business relevance
- Measure FRTB GIRR delta capital at bucket level rather than only as a portfolio total.
- Identify the buckets responsible for the largest share of regulatory market-risk capital.
- Quantify how much capital is reduced after rebalancing or hedging.
- Prioritise capital-efficient hedges where the reduction in K_b is economically material.
- Support trading-book optimisation, limit setting and regulatory capital management.
Solution
The solution is to use the bucket-level before-and-after capital profile as the decision map for FRTB optimisation. Figure 1 shows that GIRR capital is highly concentrated: a small number of buckets dominate the total requirement, with the largest bucket initially around 35 million and another major bucket near 14 million, while most other buckets are comparatively small. This immediately tells the risk manager where optimisation effort has the greatest potential payoff.
The orange bars show the post-optimisation capital. In the largest bucket, capital falls from roughly 35 million to around 14 million, while the second major concentration falls from about 14 million to below 10 million. Several medium-sized buckets also decline, whereas already-small buckets change little. The economic message is clear: the optimisation is not merely shifting risk cosmetically; it is materially reducing capital in the buckets that dominate the portfolio requirement.
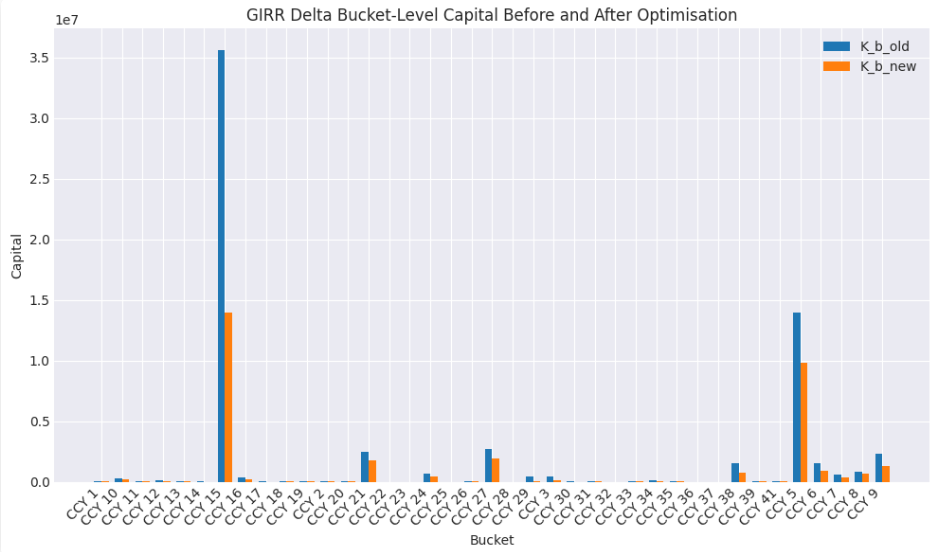
Operationally, the bank can rank buckets by absolute capital and by the reduction achieved after optimisation, then focus hedging, netting or exposure rebalancing on the positions with the highest marginal capital benefit. The graph therefore links regulatory capital directly to action: blue identifies where GIRR delta capital is currently consumed, orange shows how much remains after optimisation, and the gap between the two quantifies the capital efficiency of the proposed portfolio changes.