
Overview
This use case builds an interpretable credit scorecard for consumer lending, designed to estimate repayment risk and support approval, pricing and portfolio management decisions. Rather than using a black-box classifier, the workflow transforms raw borrower variables into binned predictors, calculates Weight of Evidence (WoE), evaluates their risk pattern and converts the final model into a points-based scorecard that can be used operationally.
The scorecard approach is especially valuable in regulated retail credit contexts because it combines predictive power with transparency. Each variable contributes a clear amount to the final score, making it easier to explain lending decisions, validate the model, monitor drift and update underwriting rules. Variables such as customer income become directly interpretable through both their bad-rate structure and their translated score contribution.
Business relevance
- Support credit approval and decline decisions with an interpretable risk score.
- Translate raw borrower characteristics into operational scorecard points.
- Understand how variables such as income change risk across bins rather than assuming a simple linear effect.
- Improve model governance, validation and explainability in regulated lending.
- Use the scorecard for underwriting, limit setting, pricing and portfolio monitoring.
Solution
The solution is to use the scorecard workflow as a transparent lending decision engine. Figure 1 shows how customer income behaves as a risk driver after binning. The bars reveal how observations and bad outcomes are distributed across income intervals, while the WoE line shows that risk is not flat across the range. Lower-income bins carry clearly worse risk signals, whereas higher-income bins tend to show more favourable WoE. This is operationally important because it confirms that income should not be treated as a raw numeric field only; it needs to be segmented into meaningful behavioural bands.
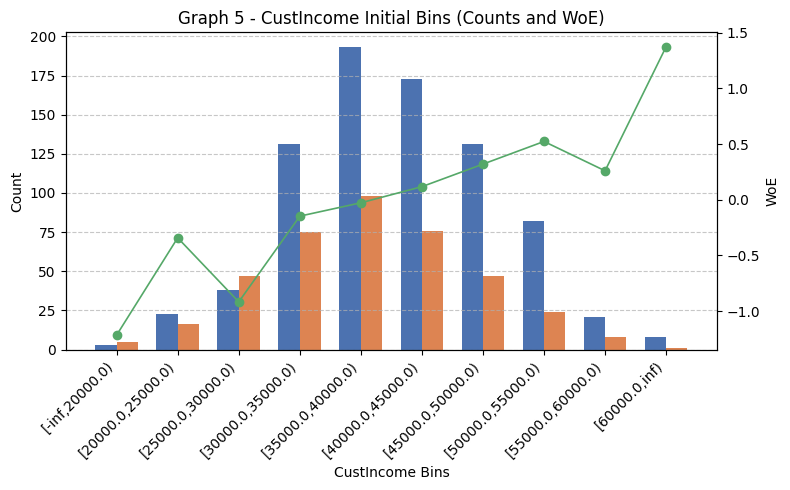
Figure 2 converts that risk pattern into action. Once the model is calibrated, each income bin receives a score contribution in points. The lowest-income bins carry strongly negative points, middle bins contribute little or moderately positive points, and the highest-income bins receive the strongest positive score contribution. This is what makes the scorecard directly usable: instead of only saying that one income level is riskier than another, the model quantifies exactly how much that difference changes the applicant's total score.
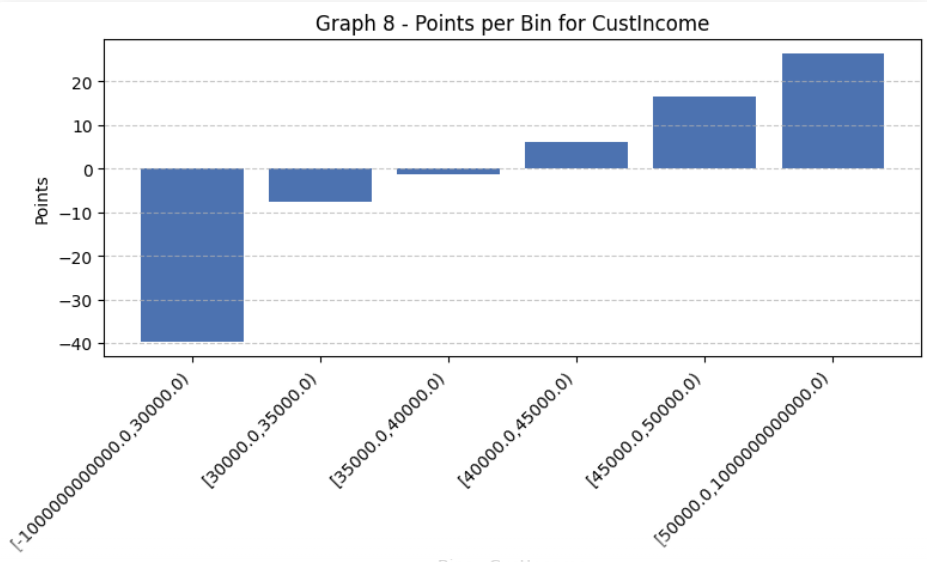
Together, the two graphics provide a complete decision logic. Figure 1 explains the empirical risk pattern behind the variable; Figure 2 translates that pattern into a production-ready scoring rule. That allows the lender to approve or reject applicants more consistently, price for risk more rationally, set cut-offs with clear business meaning and defend decisions with a transparent explanation of how customer income influenced the final score.