
Overview
This use case develops and compares Through-the-Cycle (TTC) and Point-in-Time (PIT) probability-of-default models for a corporate credit portfolio. The objective is to separate persistent borrower credit quality from the effect of the current macroeconomic environment. TTC PDs provide a more stable, cycle-neutral measure that is useful for long-term capital and risk-appetite decisions, while PIT PDs react more strongly to current and forecast macro conditions and are therefore better suited to IFRS 9 expected credit loss, staging and stress-testing applications.
The workflow combines borrower-level information with macroeconomic variables, validates discriminatory power and calibration, and compares the resulting risk estimates across years, rating or score groups and vintage cohorts. It also shows how a single modelling architecture can generate TTC, PIT and stressed PD views, supporting both accounting and prudential risk management from the same analytical framework.
Business relevance
- Forecast corporate default risk while distinguishing structural borrower risk from cyclical macroeconomic effects.
- Support IFRS 9 staging and lifetime ECL with PIT probabilities of default that react to macro conditions.
- Provide stable TTC PDs for capital planning, risk appetite and long-term portfolio steering.
- Compare model discrimination and calibration using out-of-sample validation metrics such as ROC curves.
- Detect changes in default behaviour across years and borrower vintages before they become portfolio-level losses.
Solution
The solution is to use the TTC/PIT framework as a unified corporate credit-risk engine rather than maintaining separate, disconnected views of default risk. Figure 1 shows that realised default rates are not constant across time or borrower age. The heatmap reveals clear variation by calendar year and year-on-book cohort, which means observed credit performance depends on both portfolio seasoning and the economic environment. A static PD estimate would therefore miss important changes in risk. The PIT model addresses this by allowing PD to move with current and forecast macro conditions, while the TTC view neutralises those short-term effects to preserve a more stable measure of underlying borrower quality.
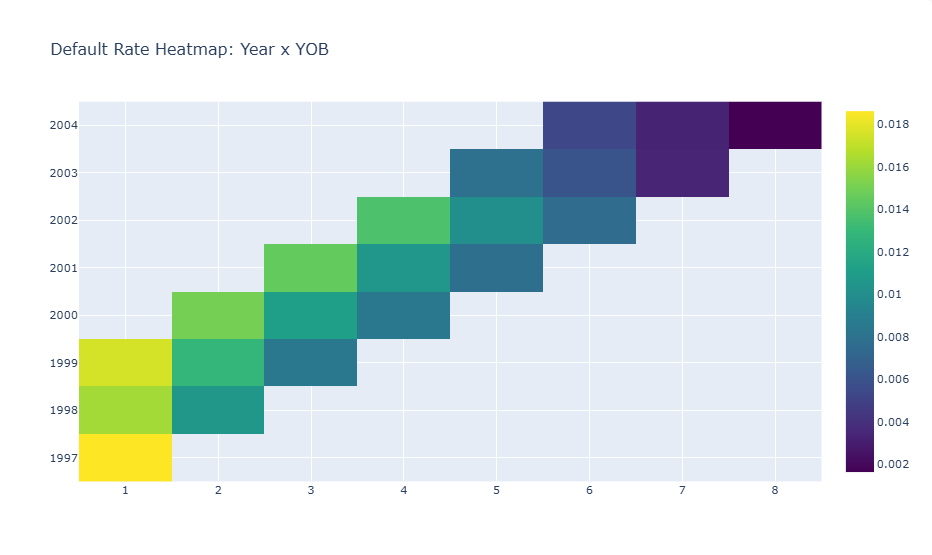
Figure 2 validates whether that extra PIT responsiveness comes at the cost of ranking quality. Both ROC curves lie materially above the random benchmark and remain very close to one another, with the PIT curve slightly stronger over much of the range. This indicates that the macro-sensitive PIT specification can improve calibration and scenario responsiveness without materially degrading the model's ability to discriminate between stronger and weaker borrowers. In practice, the bank can therefore use TTC PD for capital and long-horizon portfolio management, PIT PD for IFRS 9 ECL and staging, and stressed PIT scenarios for CCAR/ICAAP-style testing within the same governance framework.
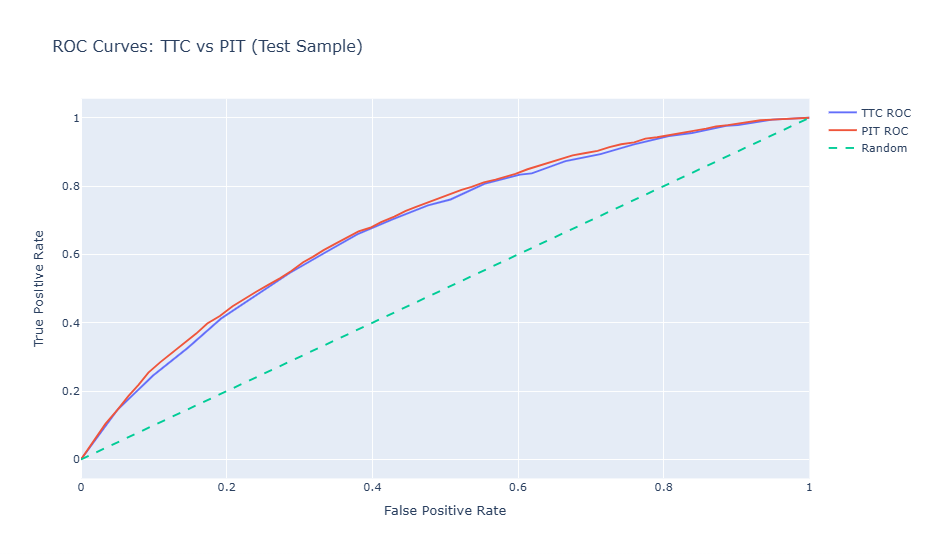
Together, the two graphics provide the management logic for the solution. Figure 1 identifies where and when default behaviour changes; Figure 2 confirms that the models still rank risk effectively. This allows credit teams to move from a single static PD toward a controlled set of cycle-neutral, current-condition and stressed PDs, improving provisioning, early-warning monitoring, capital allocation and consistency between accounting and prudential risk views.