
Overview
This use case analyses the behaviour and volatility of a broad commodity universe spanning energy, precious metals, industrial metals, agriculture, soft commodities and fertilisers. The workflow studies long-run price evolution and return distributions before applying GARCH-style volatility modelling to capture the time-varying nature of commodity risk.
Commodity markets rarely exhibit constant volatility. Periods of relative stability are interrupted by sharp shocks caused by supply disruptions, geopolitical events, weather, inventory shortages or macroeconomic regime changes. GARCH models are designed for exactly this setting: they allow current volatility to depend on recent shocks and previous volatility, producing a dynamic risk estimate rather than a single fixed historical standard deviation.
Business relevance
- Estimate time-varying volatility across energy, metals, agriculture and soft commodities.
- Detect volatility clustering and periods in which market risk rises sharply.
- Improve VaR, stress testing, hedging and position sizing for commodity exposures.
- Distinguish commodities with persistent volatility from those with more stable return behaviour.
- Support trading, treasury, procurement and commodity-risk decisions with forward-looking volatility estimates.
Solution
The solution is to use the historical commodity series as the input to a dynamic volatility engine rather than assuming that risk is stable through time. Figure 1 shows why this is necessary. Different commodities experience very different regimes, with long calm periods followed by abrupt repricing episodes. Energy and precious-metal series display especially visible jumps and multi-year volatility regimes, while several agricultural and industrial commodities show shorter but still material stress episodes. A constant-volatility model would average these regimes together and understate risk precisely when it matters most.
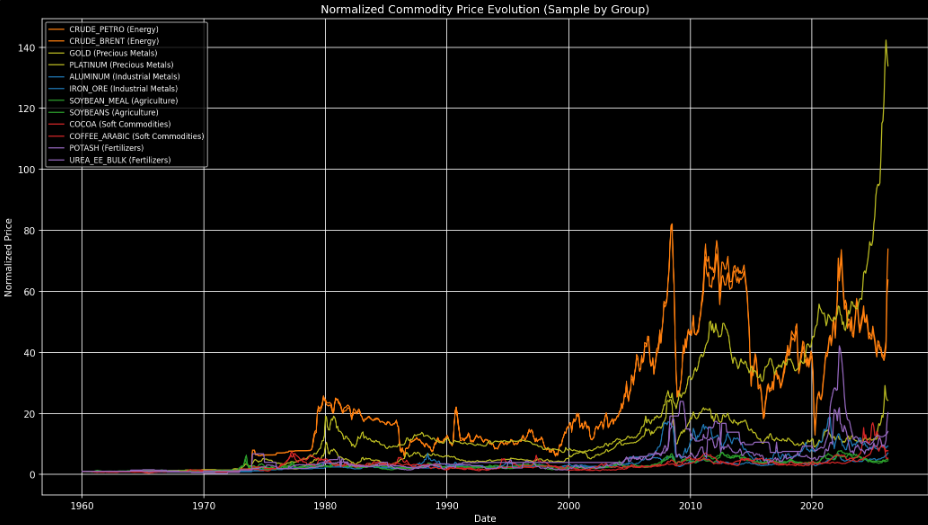
Figure 2 makes the tail behaviour explicit. The return histograms are sharply concentrated around zero but also exhibit fat tails and extreme observations, meaning large moves occur more often than a simple normal model would imply. Crude oil, gold, platinum, aluminium and iron ore do not share identical return distributions, so each exposure requires its own volatility dynamics rather than a single generic commodity-risk assumption.
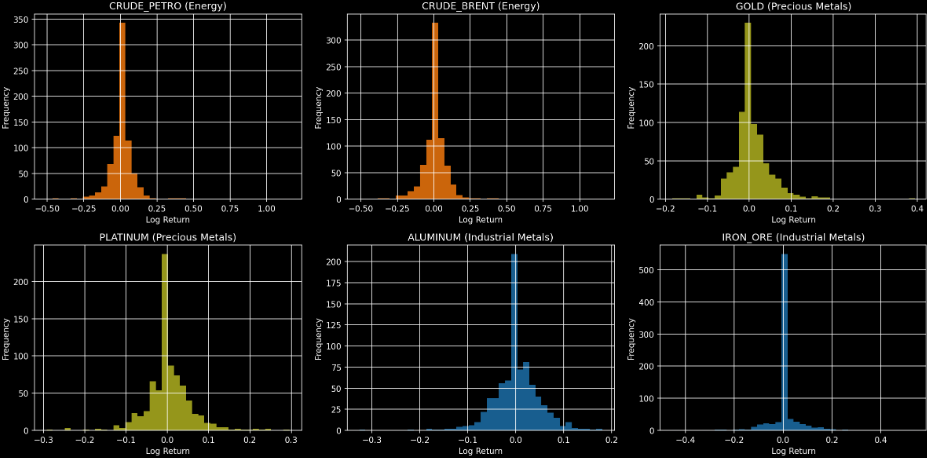
A GARCH model converts those two observations into an operational solution. Recent large returns increase the conditional volatility forecast, while volatility then decays gradually as markets normalise. That forecast can feed directly into daily VaR, hedge sizing, risk limits, margin planning and stress scenarios. Figure 1 identifies the regime shifts the model must adapt to; Figure 2 shows the non-normal return behaviour it must accommodate. Together they justify a dynamic commodity-risk framework that reacts to market conditions instead of relying on static historical averages.