
Overview
This use case analyses how the low-carbon transition can affect sectors and geographies through changes in carbon pricing, policy tightening and technology-driven disruption. Rather than treating climate risk as a generic long-term theme, the workflow converts scenario assumptions into measurable transition stress by industry and region.
The objective is to identify where the economic pressure of decarbonisation will concentrate. Some sectors are structurally more exposed to carbon costs, regulation and demand shifts, while some geographies face faster or steeper repricing paths than others. A scenario-based framework allows institutions to compare exposures consistently and to move from broad ESG discussion to explicit risk measurement.
Business relevance
- Measure transition risk across sectors, geographies and climate scenarios.
- Identify where future carbon-price escalation is likely to create the largest economic pressure.
- Support portfolio steering, lending decisions, underwriting, engagement and strategic reallocation.
- Prioritise sectors where delayed transition scenarios create the highest stress.
- Translate climate scenarios into actionable risk-management and capital-allocation insights.
Solution
The solution is to combine carbon-price pathways with sector-level stress mapping so that climate transition risk can be managed as a concrete exposure, not just as a qualitative narrative. Figure 1 shows that carbon prices do not rise uniformly across regions. Europe and Africa, for example, follow much steeper price paths than several other geographies by 2050, while China, India and the United States increase more gradually. This means the same industrial activity can face very different economic pressure depending on where it sits.
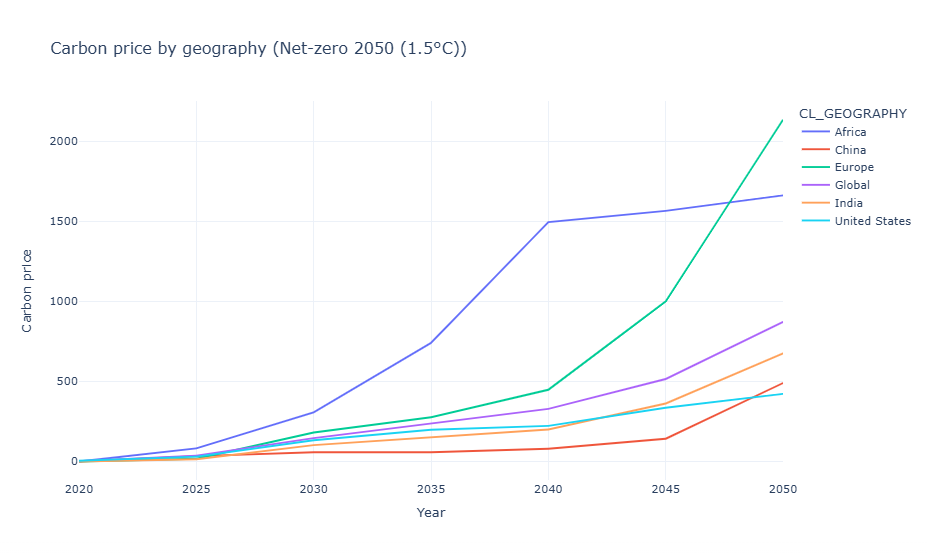
Figure 2 converts that scenario logic into sectoral vulnerability. High-emission activities such as coal, refined oil products, oil & gas, electricity and commercial transportation show materially elevated transition stress across many geographies, with some regions such as India and Africa appearing especially exposed. The heatmap makes it clear that transition risk is concentrated rather than evenly distributed.
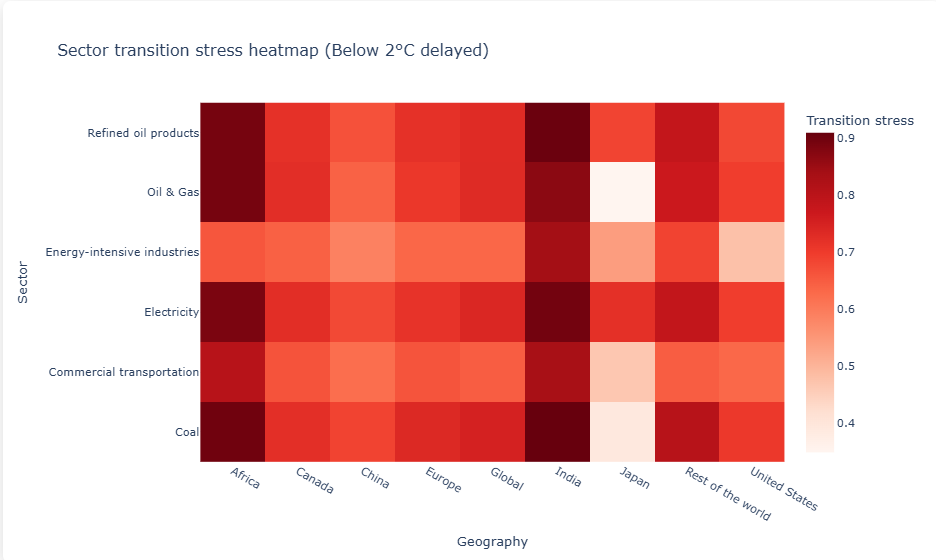
Together, the two charts provide a practical decision framework. Figure 1 tells the institution where carbon-cost escalation is likely to be most severe; Figure 2 identifies which sectors in those geographies are most likely to absorb the shock. A bank, asset manager or insurer can therefore rank exposures, tighten underwriting or financing standards in the most stressed combinations, increase engagement with vulnerable clients, design hedging or adaptation strategies, and reallocate capital toward sectors and regions with more resilient transition profiles. In short, the model turns climate transition risk into a prioritised map of where intervention is most urgent.