
Overview
This use case applies modern portfolio theory to construct and analyse diversified equity portfolios using expected returns, volatility and the covariance structure between assets. The workflow estimates how individual securities move together, builds the portfolio risk-return opportunity set and identifies efficient allocations such as the Global Minimum Variance (GMV) portfolio and the tangency portfolio.
The objective is to avoid selecting assets only on the basis of standalone return or volatility. Portfolio risk depends on cross-asset relationships: securities with imperfect correlation can reduce total volatility even when each asset is risky in isolation. The optimisation therefore turns a large universe of securities into a set of portfolios that offer the highest expected return for a given level of risk, or the lowest risk for a required return.
Business relevance
- Construct diversified portfolios using the full covariance structure rather than standalone asset metrics.
- Identify the minimum-risk allocation available within the investable universe.
- Find the tangency portfolio that maximises expected excess return per unit of risk.
- Visualise the trade-off between expected return and volatility through the efficient frontier.
- Support strategic asset allocation, portfolio rebalancing and risk-budgeting decisions.
Solution
The solution is to use the covariance and correlation structure of the asset universe as the foundation for portfolio construction. Figure 1 shows that the assets are not perfectly correlated: some pairs move together strongly, others only moderately and a number of relationships are close to zero or negative. Those differences are the source of diversification. A portfolio built only from the highest-return stocks could concentrate risk, whereas combining assets with weaker correlations can lower total volatility without reducing expected return proportionally.
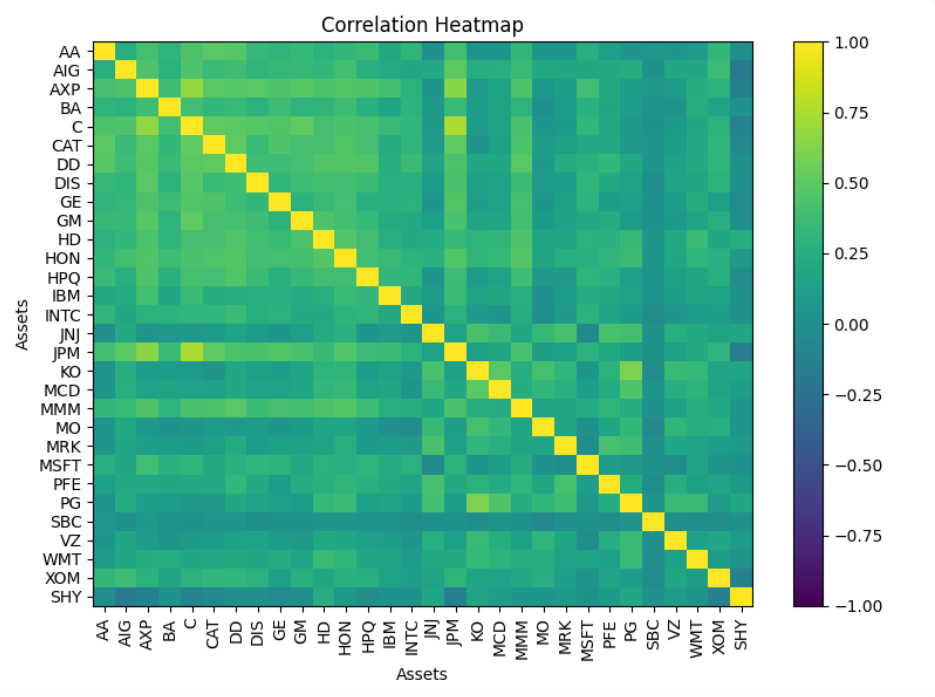
Figure 2 translates those relationships into investable portfolio choices. The efficient frontier represents the portfolios that dominate all inferior combinations: for each level of volatility, they offer the highest attainable expected return. The GMV point identifies the lowest-volatility portfolio in the opportunity set, while the tangency portfolio is the point where the Capital Market Line touches the frontier and therefore provides the strongest risk-adjusted expected return relative to the risk-free asset.
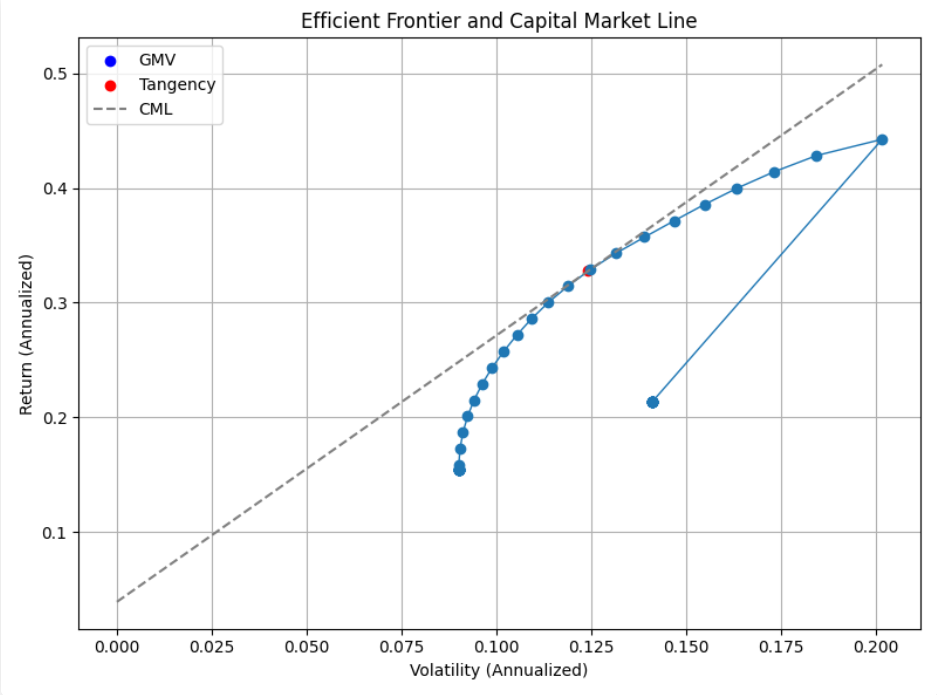
Together, the two charts create a practical allocation framework. Figure 1 explains where diversification benefits come from; Figure 2 shows how those benefits should be converted into portfolio weights. An investment manager can choose the GMV portfolio when capital preservation is the priority, move along the frontier when a higher return target is required, or use the tangency portfolio when maximising expected Sharpe ratio is the objective. The result is a disciplined asset-allocation process in which each portfolio choice is explicitly tied to measurable risk, return and diversification.