
Overview
This use case applies the Brinson-Fachler framework to explain why an investment portfolio outperformed or underperformed its benchmark. Instead of treating active return as a single number, the model decomposes it into the effect of asset allocation, security selection and the interaction between both decisions at sector level.
The result is an interpretable performance-attribution layer for portfolio managers. It reveals whether value was created because the manager overweighted the right sectors, selected better securities within those sectors, or benefited from the interaction between allocation and selection. This allows investment teams to distinguish repeatable investment skill from benchmark effects and short-term noise.
Business relevance
- Explain active portfolio return relative to a benchmark in a transparent way.
- Separate allocation skill from security-selection skill.
- Identify which sectors contributed most positively or negatively to relative performance.
- Support portfolio-manager evaluation, investment committee reviews and client reporting.
- Detect whether active performance is persistent or driven by isolated months or benchmark choice.
Solution
The solution is to use attribution analysis as a diagnostic layer behind every period of active performance. Figure 1 shows that positive total attribution is not generated in the same way across sectors. For example, Consumer Defensive combines a positive allocation effect and a positive selection effect, while its interaction effect is slightly negative. Communication Services also contributes positively through both allocation and selection. This allows the portfolio manager to see which decisions actually created value instead of relying only on total return.

Figure 2 adds the time dimension. Active return changes materially from month to month and differs depending on the benchmark used. There are months of strong positive relative performance, followed by periods of underperformance such as the sharp negative move around May 2026. That means a single cumulative number can hide important instability. The manager needs both attribution by decision type and a time-series view of active return to determine whether performance is repeatable.
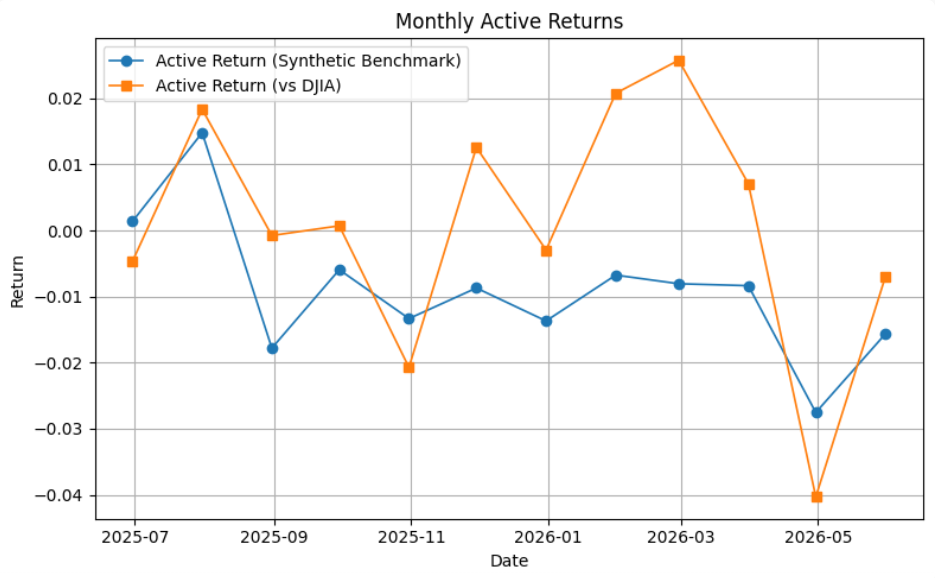
Together, the two charts provide a complete portfolio-review framework. Figure 1 identifies the sectors and investment decisions responsible for active return; Figure 2 shows when those decisions translated into outperformance or underperformance. This allows the investment team to reinforce sectors where allocation or selection skill is consistently positive, reduce exposures where active decisions repeatedly destroy value, and communicate performance to clients and committees with a clear explanation of what actually drove the result.