Proxima Alpha
What is the risk-adjusted return of investing in SPY compared to a portfolio of emerging market ETFs in light of the recent geopolitical tensions and their impact on oil prices?
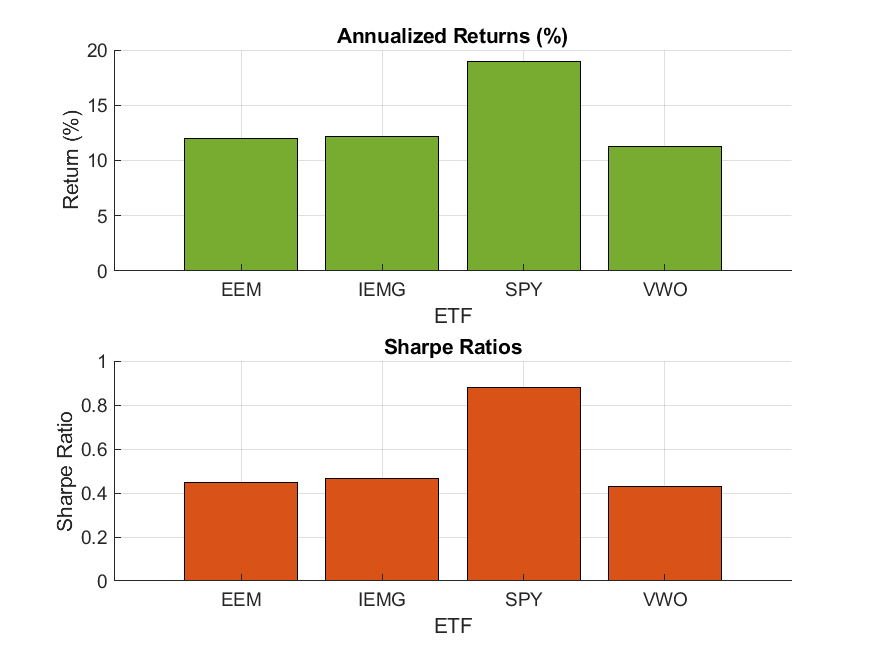
21-Sep-2025 07:08:08The analysis has calculated the risk-adjusted returns, specifically the Sharpe ratios, for the SPDR S&P 500 ETF (SPY) and a group of prominent emerging market ETFs (EEM, VWO, and IEMG) over the past three years ending 21-Sep-2025. This calculation used historical daily price data and compared annualized returns, annualized volatility, and Sharpe ratios assuming a risk-free rate of 4.25% (reflecting the current US monetary environment).
Key findings are:
- Annualized Returns: SPY achieved the highest annualized return of approximately 18.94%, whereas the emerging market ETFs showed lower returns in the range of 11.29% to 12.16%.
- Volatility: SPY exhibited slightly lower volatility compared to the emerging market ETFs, indicating less overall risk.
- Sharpe Ratios (Risk-Adjusted Returns): SPY's Sharpe ratio is about 0.88, substantially higher than the emerging market ETFs, which have Sharpe ratios around 0.43 to 0.47. This indicates SPY offered the best risk-adjusted returns during this period.
The accompanying bar charts visually represent these comparisons between SPY and the selected emerging market ETFs:
Interpretation in the geopolitical and oil price context:
Geopolitical tensions, especially those impacting oil prices, tend to influence emerging markets more negatively due to their higher exposure to energy price volatility, inflation pressures, and structural economic risks. The US equity market, represented by SPY, tends to be more stable with better earnings resilience in these environments. These factors align well with the calculated stronger risk-adjusted performance of SPY relative to emerging market ETFs.
Data and Methodology:
We used daily historical price data for all ETFs for the last three years, calculating daily returns, and annualizing these to compute returns and volatility. The Sharpe ratio was then computed by adjusting excess returns over the risk-free rate by the volatility to measure risk-adjusted performance.
Next Steps and Recommendations:
- Incorporate more detailed geopolitical and oil price datasets and analysis for a richer context on how these factors specifically impact each market segment.
- Consider including additional risk metrics (like Sortino ratio, Beta) for a more comprehensive risk assessment.
- Assess portfolio diversification or active management strategies to mitigate emerging markets' volatility and risk exposure under current geopolitical realities.
- Regularly update this analysis to account for rapidly changing geopolitical and economic conditions.
The results align well with institutional views that under geopolitical stress and oil price volatility, US equities have generally offered superior risk-adjusted returns versus emerging markets. If you desire, I can extend this analysis or focus on alternative risk measures or timeframes.