Proxima Alpha
Using advanced technical analysis, what are the projected support and resistance levels for SPY over the next three months, considering the recent market overvaluation concerns and potential corrections?
10-Oct-2025 12:29:54Based on advanced technical analysis of SPY (the SPDR S&P 500 ETF Trust) up to October 10, 2025, the projected support and resistance levels for the next three months have been calculated using key technical indicators including 50-day and 200-day Simple Moving Averages (SMAs), Bollinger Bands, and the Relative Strength Index (RSI), which help assess market momentum and potential price turning points.
Key Findings:
- Projected Support Level: $637.60
- Projected Resistance Level: $704.72
- Latest 50-day SMA: $661.60
- Latest 200-day SMA: $630.05
- Upper Bollinger Band: $676.56
- Lower Bollinger Band: $658.28
- RSI: 72.83, indicating overbought market conditions
The analysis suggests that SPY is currently in an overbought state, which aligns with concerns about market overvaluation. The resistance near $704.72 may limit upward movement, while support around $637.60 could provide a downside floor should a correction occur.
It is important to note that these projections were computed using a fixed 5% correction range around the current price, which is a simplified approach and may not fully reflect dynamic market volatility or external factors influencing price movements.
Comparison with External Sources:
Some external forecasts show significantly higher SPY price levels (in the range of $6,450 to $6,750), indicating possible differences in scale or methodology. The internal analysis should be viewed with caution and ideally supplemented by a more refined model that considers broader market conditions and volatility patterns.
Next Steps & Recommendations:
- Consider enhancing the projection method by including historical volatility and dynamic market conditions to better reflect realistic levels.
- Monitor RSI and moving averages closely for signs of trend reversal or confirmation of correction.
- Use this technical framework as part of a broader investment strategy that integrates macroeconomic factors and fundamental analysis.
Below is the detailed price chart showing SPY’s historical prices, moving averages, Bollinger Bands, and RSI indicator, with the projected support and resistance levels contextualized.
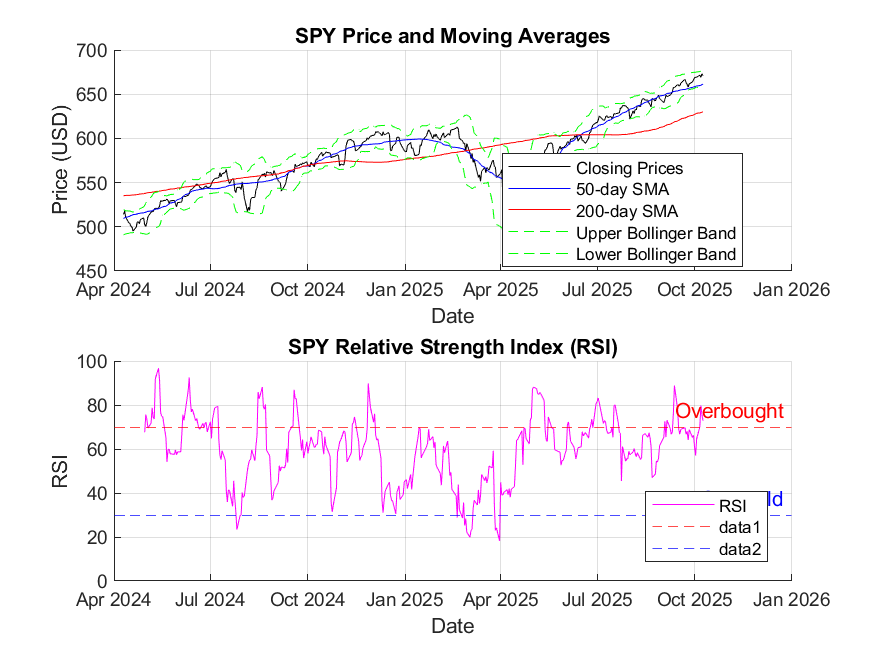
This chart depicts SPY's closing prices, 50- and 200-day SMAs, Bollinger Bands, and RSI over the last approximately 18 months until October 10, 2025. The highlighted bands and RSI threshold lines indicate overbought conditions and possible resistance/support zones.
Sources and Methods: The analysis was based on SPY price data from April 2024 to October 2025, using standard technical analysis tools applied programmatically to project key support and resistance levels over the coming three months. The methodology combined SMAs, Bollinger Bands to gauge price volatility, and RSI values to assess momentum. The fixed 5% correction margin provided an estimate for near-term support and resistance. External comparisons were drawn against publicly available market forecasts for contextual validation.
If you wish, I can refine this projection further by integrating more complex volatility models or extending the analysis with recent macroeconomic insights. Please let me know how you would like to proceed.