Proxima Alpha
The importance of diplomatic effords: Using UCDP GED event data, build an animated geospatial visualization of worldwide conflict intensity from 2015 to 2024, then apply an spatiotemporal forecasting model to project future conflict hotspots up to 2030 in the absence of major diplomatic agreements such as the Trump peace accords. Include clustering to identify and label the most intense forecasted regions by country.
14-Oct-2025 11:29:07Executive Summary:
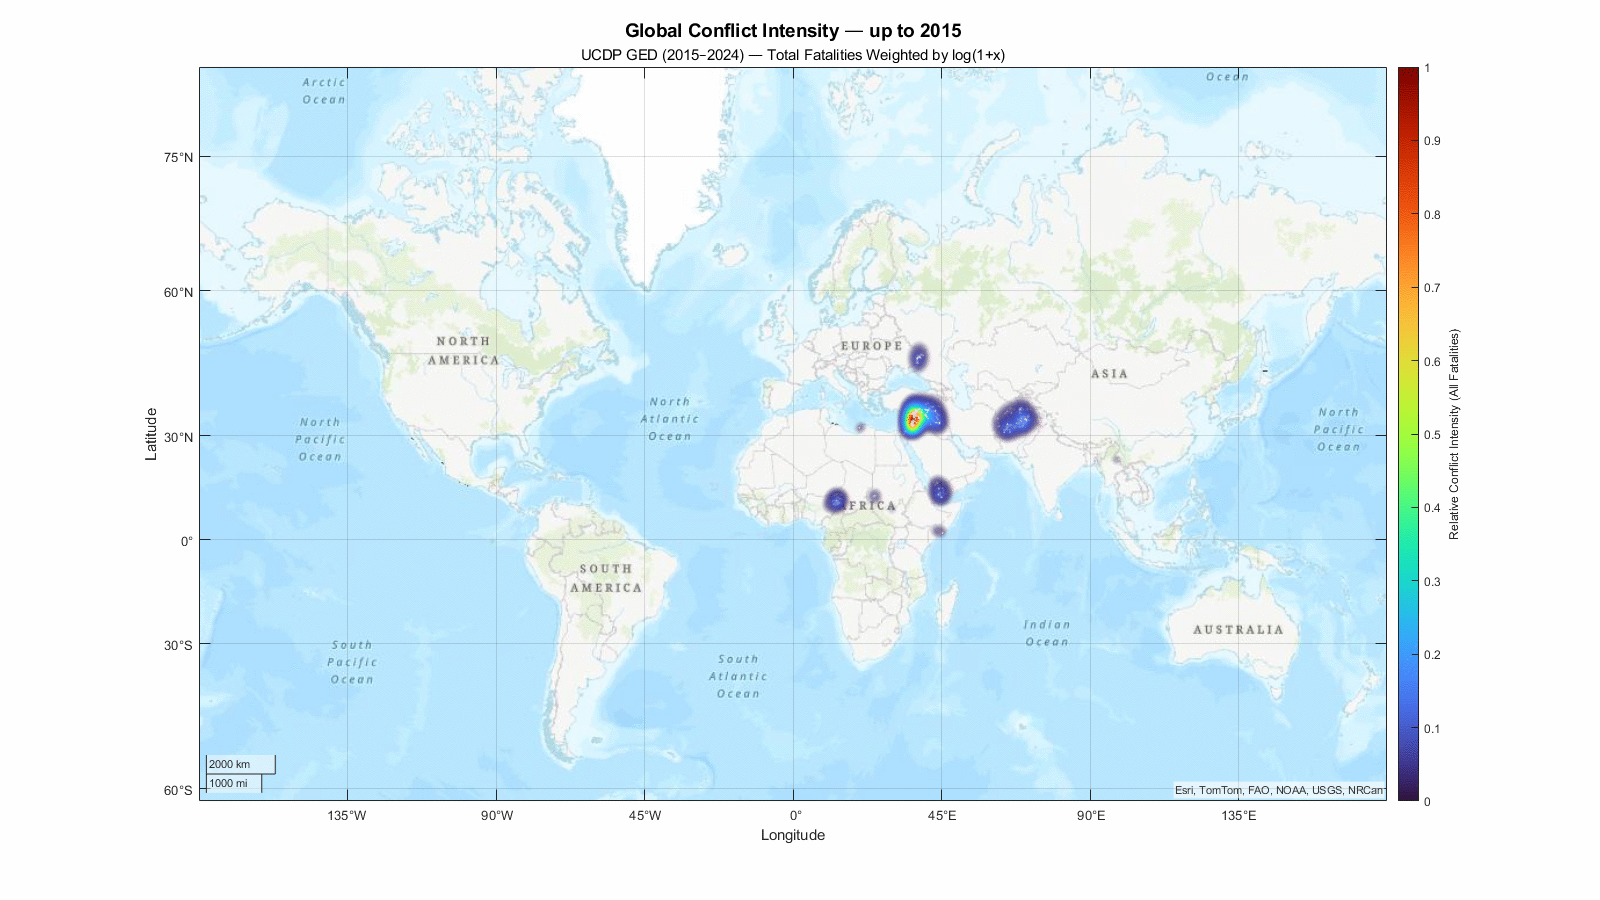
An animated global geospatial visualization of conflict intensity from 2015 to 2024 was created using the UCDP Georeferenced Event Dataset (GED). This visualization depicts fatalities associated with conflict events worldwide on a spatial grid. Subsequently, a spatiotemporal forecasting model, specifically a stable AR(1) plus diffusion process, was employed to project conflict intensity from 2025 to 2030 assuming no major diplomatic accords like the Trump peace accords occur. Using DBSCAN clustering on the 2030 forecast, the most intense conflict hotspots were identified and labeled by country. The findings reflect the persistence and potential worsening of conflict zones under absent diplomatic efforts.
Methodology and Sources:
- Data Source: UCDP GED Global version 25.1, covering 2015 to 2024 conflict events with geocoordinates and fatalities.
- Conflict Intensity Metric: Aggregated fatalities weighted by logarithmic transform to stabilize variations.
- Visualization: Kernel density estimation on a 1°x1° latitude-longitude grid aggregated yearly, animated over 2015-2024.
- Forecasting Model: A stable AutoRegressive model of order 1 with spatial diffusion and noise simulated conflict intensity for 2025-2030.
- Clustering: Density-Based Spatial Clustering of Applications with Noise (DBSCAN) identified hotspot regions based on forecast intensity distribution in 2030.
Key Results:
- The animated map shows concentrated conflict intensity in regions such as Ukraine, Syria, Afghanistan, Ethiopia, Mexico, Myanmar, Nigeria, and others during 2015-2024.
- The forecasting model predicts extending or intensifying hotspots in these regions through 2030 if no significant diplomatic agreements intervene.
- DBSCAN clustering labels the top forecasted hotspots by country, highlighting regions at high risk of sustained or increased conflict.
Visualizations:
The first animation illustrates the yearly global distribution of conflict intensity (fatalities) from 2015 to 2024:
The second animation shows the model-based forecast of conflict intensity from 2025 to 2030 with hotspot emergence and spatial diffusion:

Most Intense Forecasted Hotspot Countries by 2030:
- Ukraine
- Syria
- Afghanistan
- Ethiopia
- Mexico
- Myanmar
- Nigeria
- Burkina Faso
- Mozambique
- Somalia
- Libya
- Brazil
- Democratic Republic of the Congo
- Ecuador
- Philippines
- Haiti
- India
- Colombia
Recommendations and Next Steps:
- Focus diplomatic efforts on the identified high-risk countries to prevent escalation.
- Integrate further socioeconomic, political, and environmental variables to refine forecasting.
- Develop early-warning systems based on updated conflict intensity projections.
- Analyze potential effects of specific peace accords to quantify their impact on reducing hotspots.
Explanation of Process: The analysis started by extracting spatial-temporal conflict event data (fatalities, locations, dates) from the UCDP GED. The conflict intensity was aggregated spatially on a global grid and temporally by year, producing an animated intensity map. A spatiotemporal autoregressive model with diffusion was then fitted to this historical data to simulate plausible future intensities assuming continuing conflict trends without peace initiatives. This forecast was spatially clustered to identify and label the most severe conflict zones by country. The visual outputs help stakeholders understand historical patterns and forecast future risks reinforced by quantitative modeling.