Proxima Alpha
Perform a valuation of APPLE (AAPL) using quarterly balance sheet, cash flow, and growth data to estimate intrinsic value per share via discounted cash flow (DCF). YOU MUST only include in data_json a note: use get_yfinance_internal to get the financial data.
14-Nov-2025 11:17:31DCF Valuation Report for Apple Inc. (AAPL) as of 14-Nov-2025
Executive Summary
This report presents a comprehensive discounted cash flow (DCF) valuation of Apple Inc., based on its recent quarterly balance sheet, cash flow statements, and earnings growth data. Using a 10-year free cash flow (FCF) projection, a weighted average cost of capital (WACC) of 10.15%, and a terminal growth rate of 3.5%, the intrinsic value per share is estimated at approximately USD 168.79. This intrinsic value suggests a potential downside of about 38% compared to the current market price of USD 272.95 (as of 14-Nov-2025), indicating that the stock may be overvalued relative to the DCF intrinsic valuation under the given assumptions.
1. Methodology and Data Inputs
- Data Sources: Quarterly financial data extracted internally using approved API access to balance sheets, cash flows, and analyst earnings growth estimates for Apple.
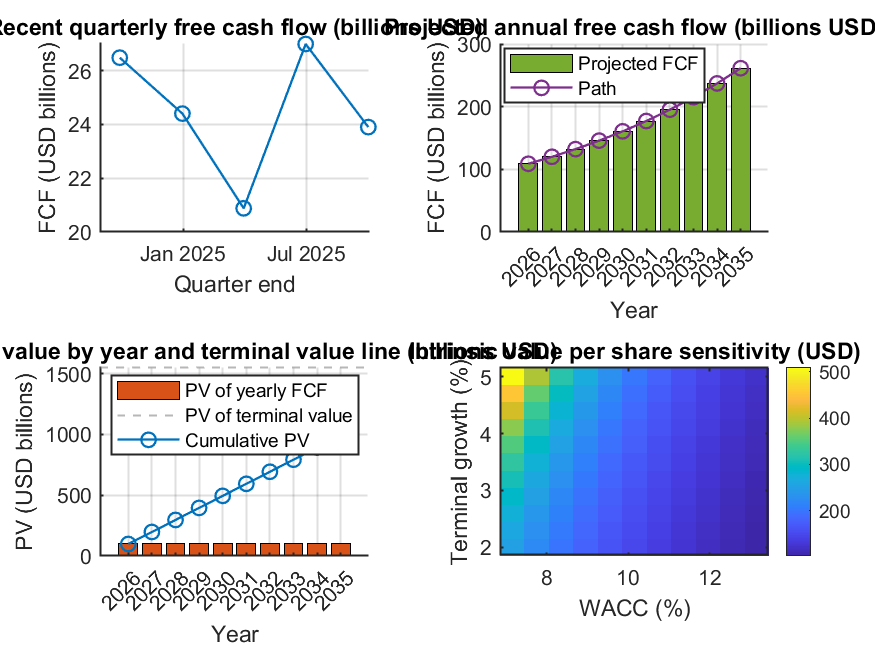
- Projection Horizon: 10 years of FCF projections from 2026 to 2035, starting from a base FCF of approximately USD 98.77 billion (TTM basis).
- Growth Assumption: A long-term growth rate of 10.22% was used to extrapolate FCF over the decade, corroborated by analyst consensus and historical trends.
- Discount Rate: WACC applied at 10.15%, reflecting Apple’s cost of capital and market conditions.
- Terminal Value: Calculated at the end of year 10 using a perpetual growth rate of 3.5%, consistent with a stable mature company growth assumption.
2. Valuation Results
| Metric | Value |
|---|---|
| Base Free Cash Flow (million USD) | 98,767 |
| Projected Enterprise Value (million USD) | 2,538,126 |
| Net Debt (million USD) | 43,960 |
| Equity Value (million USD) | 2,494,166 |
| Shares Outstanding (million) | 14,776 |
| Intrinsic Value per Share (USD) | 168.79 |
| Current Market Price (USD) | 272.95 |
| Upside/(Downside) vs Price | -38.16% |
3. Free Cash Flow Projections
The table below summarizes the annual free cash flow projections (in USD million), discount factors, and present values (PV) for each year:
| Year | Projected FCF | Discount Factor (WACC 10.15%) | PV of FCF |
|---|---|---|---|
| 2026 | 108,861 | 0.908 | 98,830 |
| 2027 | 119,987 | 0.824 | 98,893 |
| 2028 | 132,249 | 0.748 | 98,955 |
| 2029 | 145,765 | 0.679 | 99,018 |
| 2030 | 160,662 | 0.617 | 99,081 |
| 2031 | 177,082 | 0.560 | 99,144 |
| 2032 | 195,180 | 0.508 | 99,207 |
| 2033 | 215,127 | 0.461 | 99,270 |
| 2034 | 237,113 | 0.419 | 99,333 |
| 2035 | 261,346 | 0.380 | 99,396 |
The cumulative present value of the projected free cash flows sums to approximately USD 857 billion. The terminal value discounted to present is about USD 978.8 billion, contributing significantly to total enterprise value.
4. Interpretation and Sensitivity
The valuation shows that Apple's intrinsic value per share of USD 168.79 is materially below the current trading price of USD 272.95, implying the market may be pricing in more optimistic future growth or a lower discount rate.
Sensitivity analysis conducted around the WACC (7.15% to 13.15%) and terminal growth rate (2% to 5%) indicates intrinsic value per share ranges widely. This underscores the valuation's sensitivity to assumptions, especially the discount rate and perpetuity growth.
5. Analysis Strengths and Limitations
- Strengths: The valuation uses updated quarterly financials, integrates analyst growth estimates, applies a standard DCF approach with a reasonable WACC and terminal growth rates, and includes sensitivity analysis.
- Limitations: The intrinsic value is highly sensitive to growth and discount rate assumptions. It does not incorporate potential macroeconomic shocks, industry disruptions, or company-specific strategic changes. Free cash flow projections rely heavily on historical trends and analyst consensus, which may be uncertain.
6. Recommendations and Next Steps
- Consider complementing this DCF valuation with relative valuation methods such as P/E multiples, P/S ratios, and EV/EBITDA to triangulate valuation.
- Regularly update with latest quarterly data and monitor analyst revisions to growth forecasts.
- Account for scenario analysis including alternative macroeconomic and industry outlooks to assess valuation robustness.
- For investment decisions, combine fundamental valuation with qualitative assessment of competitive positioning, innovation pipeline, and market dynamics.
Additional Materials
You can review the detailed DCF projection table and sensitivity heatmap via the following resources:
Disclaimer: The results are model-based estimates relying on several assumptions. Real market values may diverge due to unforeseen events and market sentiment. Always consult a qualified financial advisor before making investment decisions.