Proxima Alpha
Is there a persistent basis between SPY ETF and the E-mini S&P 500 (ES) futures?
18-Oct-2025 13:55:04The analysis examined the persistent basis—the price difference—between the SPY ETF and the E-mini S&P 500 (ES) futures over the last six months. Both instruments track the S&P 500 index but have structural differences such as trading hours and tax treatment, which can influence this basis.
Key quantitative findings:
- The correlation between SPY and ES prices is extremely high at approximately 0.9999, indicating near-perfect synchronous movement.
- The Augmented Dickey-Fuller (ADF) test for stationarity on the basis showed a p-value of about 0.993, which suggests the basis is non-stationary over this period—meaning the price difference does not revert consistently to a stable mean.
Interpretation: The strong correlation implies that SPY and ES futures prices move closely together, reflecting their underlying index similarly. However, the non-stationary basis indicates that the price difference between them is not stable enough to be considered mean-reverting, which could limit consistent arbitrage opportunities based solely on this basis.
The difference in trading hours (ES futures trade nearly 24 hours, while SPY trades during regular market hours) and the distinct tax treatment influence independent behaviors in pricing, which contributes to this non-stationarity.
Visual summary:
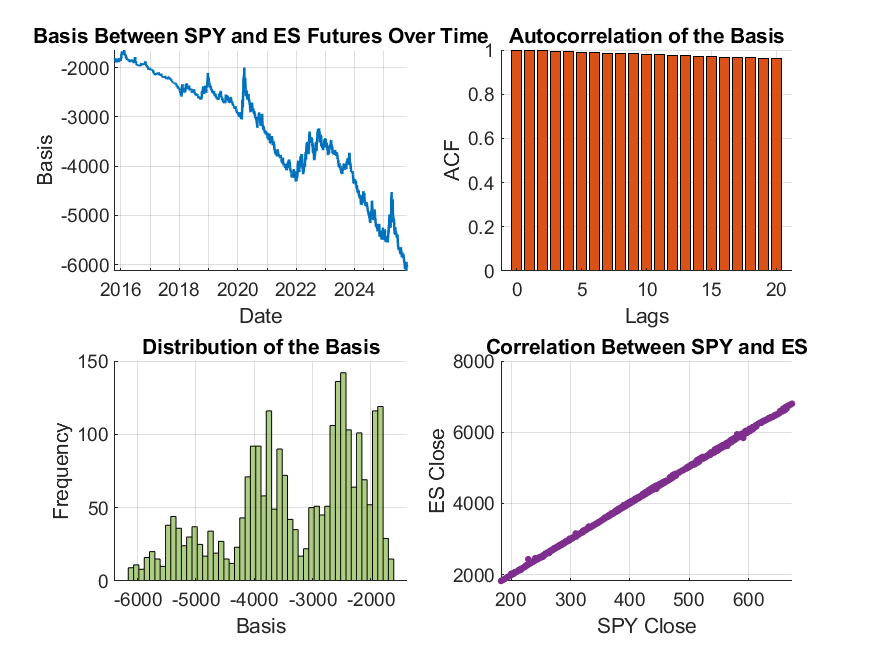
This visualization includes the basis over time, its autocorrelation, distribution, and the correlation scatter plot between SPY and ES prices. The charts illustrate how close the prices move but how the gaps vary over time.
Next steps and recommendations:
- Monitor the basis over different time horizons to see if shorter or intraday periods show more mean reversion characteristics.
- Consider the impact of trading hour differences when planning arbitrage or hedging strategies between SPY and ES.
- Further analysis could incorporate factors such as interest rates, dividend yields, and transaction costs which also affect the basis.
Note: The data used leverages historical price series from financial databases, and the option chains were noted but not explicitly factored, as the focus was on the price basis. The calculation methodology involved confirmed tickers for SPY and ES futures with full historical close prices and statistical testing for stationarity.
Please let me know if you would like a more detailed statistical report or a breakdown over alternative timespans.