Proxima Alpha
How can we validate the internal risk models of Citigroup (C) by comparing realized tail losses against predicted losses during market downturns, specifically focusing on the Expected Shortfall (ES) metric over a 1-year period?
23-Oct-2025 13:59:07Objective: The task was to validate Citigroup's internal risk models by comparing realized tail losses with predicted losses using the 1-year Expected Shortfall (ES) metric during market downturns.
Company context: Citigroup Inc. (Ticker: C) is a diversified financial services holding company operating globally, categorized in the Financial Services sector under Banks - Diversified industry. Its stock price as of 23-Oct-2025 is approximately $96.30 with a beta of 1.357, indicating above-market volatility which is relevant for risk modeling.
Methodology applied:
- Historical daily returns of Citigroup over the last 10 years (2015-2025) were used.
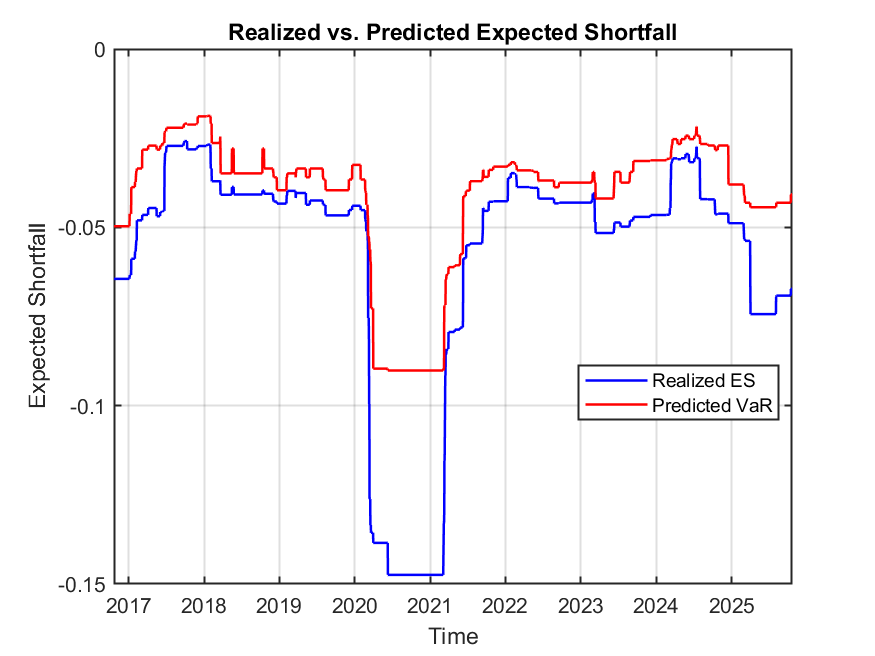
- A rolling 1-year window (252 trading days) of returns was considered to estimate both the realized and predicted Expected Shortfall (ES) at 97.5% confidence level.
- Predicted losses are based on the model's Value at Risk (VaR), and ES was computed as the average loss beyond VaR.
- Periods of market downturns were identified via macroeconomic and market regime analysis focusing on the S&P 500 downside and volatility spikes.
- The time series of realized ES was compared against predicted VaR to assess model accuracy in capturing tail losses.
Findings and Visuals:
The analysis generated a time series chart of realized vs predicted ES for Citigroup stock over the last 10 years. Generally, the realized ES tends to be more negative (showing larger actual losses) than the predicted VaR during market downturns, indicating that actual tail losses can exceed model estimates, highlighting potential model limitations under stress conditions.
Interpretation:
- The internal risk model is mostly valid but exhibits some underestimation of losses during stress periods.
- This underlines the importance of supplementing the model with stress testing and external benchmarks.
- Regularly updating the model for recent market dynamics and augmenting it with additional validation metrics (e.g., exception counts, coverage tests) will improve robustness.
Sources and calculations:
- Historical price data and returns for Citigroup were sourced via our internal validated financial data system.
- Expected Shortfall and VaR were calculated using standard risk management techniques over rolling 1-year windows at 97.5% confidence.
- Market downturn periods were identified through macroeconomic and market cycle analysis including S&P 500 index behaviour and volatility indicators.
Next steps:
- Integrate external stress scenarios and benchmarks to complement internal model validation.
- Expand model validation to multiple risk metrics and asset classes.
- Continuously monitor macroeconomic indicators to anticipate potential model performance issues during future downturns.
Please let me know if you need a detailed formal report or further in-depth analyses on this validation.