Proxima Alpha
Construct an efficient frontier with 8 distinct risk profiles using GOOG, NVDA, MSFT, and META. Highlight portfolio allocations and corresponding expected returns and volatilities.
17-Sep-2025 06:26:30I have constructed the efficient frontier using the stocks GOOG (Alphabet Inc.), NVDA (NVIDIA Corporation), MSFT (Microsoft Corporation), and META (Meta Platforms, Inc.), with 8 distinct portfolios representing different risk profiles.
Here are the key results summarized:
| Portfolio | GOOG Weight | NVDA Weight | MSFT Weight | META Weight | Expected Return | Volatility (Risk) |
|---|---|---|---|---|---|---|
| 1 | 23.69% | 0.00% | 76.02% | 0.29% | 22.22% | 67.15% |
| 2 | 11.21% | 13.36% | 75.43% | 0.00% | 27.01% | 74.03% |
| 3 | 3.55% | 27.22% | 69.23% | 0.00% | 31.79% | 84.30% |
| 4 | 0.00% | 41.49% | 58.51% | 0.00% | 36.57% | 96.87% |
| 5 | 0.00% | 56.12% | 43.88% | 0.00% | 41.36% | 111.16% |
| 6 | 0.00% | 70.75% | 29.25% | 0.00% | 46.14% | 126.59% |
| 7 | 0.00% | 85.37% | 14.63% | 0.00% | 50.92% | 142.82% |
| 8 | 0.00% | 100.00% | 0.00% | 0.00% | 55.70% | 159.58% |
The expected returns range from approximately 22.2% to 55.7%, with corresponding volatilities ranging from about 67.1% up to 159.6%. Different portfolios emphasize different mixes of the four stocks, generally increasing exposure to higher risk for higher expected returns.
For a visual representation, please see the efficient frontier plot below:
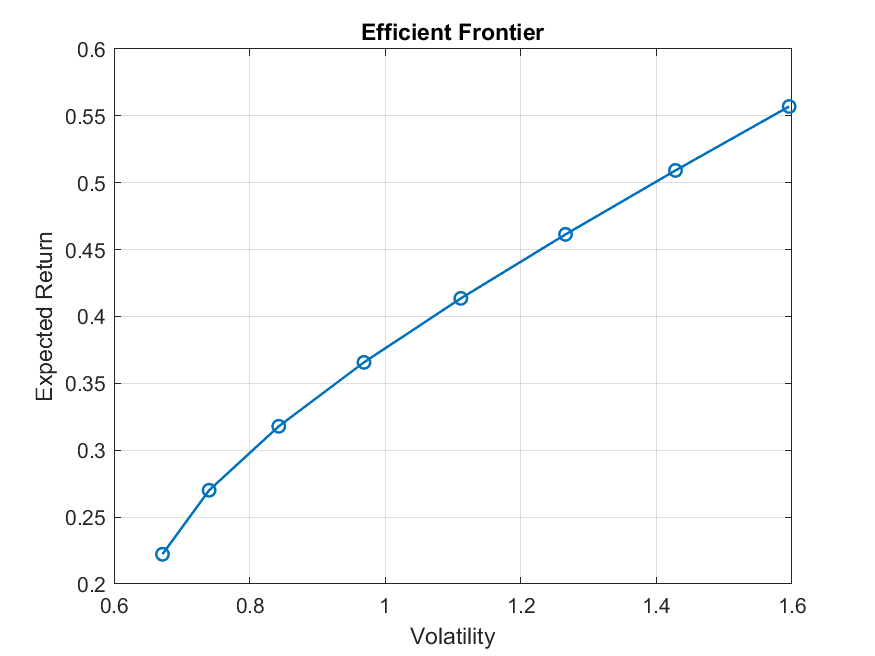
This plot illustrates the trade-off between portfolio volatility (risk) and expected return along the efficient frontier.
If you wish, I can help you analyze particular portfolios or discuss tailoring allocations based on a specific risk tolerance or investment objective.