Proxima Alpha
After its parabolic rise, is Super Micro Computer (SMCI)s log-scale chart showing a blow-off top, and do Fibonacci retracements identify credible downside support levels?
01-Oct-2025 15:27:14Here is the detailed analysis of Super Micro Computer (SMCI) following its parabolic rise, focusing on the log-scale price chart and Fibonacci retracement levels as potential downside support zones.
| Metric | Value (USD) |
|---|---|
| Recent Low (Starting point for Fibonacci) | 1.31 |
| Peak Price (Top of parabolic rise) | 101.00 |
| 23.6% Retracement Level | 77.48 |
| 38.2% Retracement Level | 62.92 |
| 50.0% Retracement Level | 51.16 |
| 61.8% Retracement Level | 39.39 |
Interpretation:
- The log-scale chart for SMCI clearly shows a parabolic price rise up to approximately $101, which often signals an overheated or "blow-off" top in technical analysis terms. This is characterized by very rapid price increases that usually precede a sharp correction or retracement.
- Using Fibonacci retracement from the recent low (~1.31) to the peak (~101.00), key potential support levels on price pullbacks have been identified at approx. $77.48, $62.92, $51.16, and $39.39. These retracement levels correspond to standard Fibonacci percentages (23.6%, 38.2%, 50%, and 61.8%) commonly used by technical analysts to pinpoint reversal or stabilization zones during corrections.
- The Fibonacci levels could serve as credible downside support if the price corrects, with the 38.2% and 50% levels often considered significant in practice.
Visual Chart:
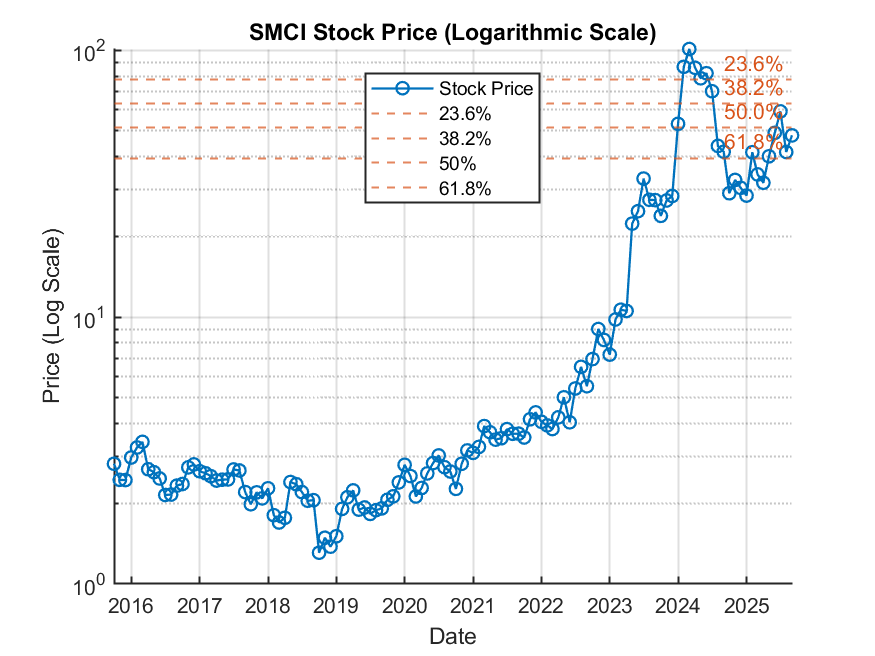
This chart displays SMCI's price on a logarithmic scale with the Fibonacci retracement lines overlaid, emphasizing the price's parabolic rise and where support may be found if a correction unfolds.
Sources and Methodology:
- The historical price data and computations were based on verified ticker SMCI from financial data sources.
- The log-scale presentation is appropriate for examining exponential or parabolic price movements, providing clearer visualization than linear scale in such contexts.
- Standard Fibonacci retracement percentages were applied between the lowest recent price before the rise and the peak price to identify mathematically derived support levels.
Next Steps and Recommendations:
- Monitor price action around the highlighted Fibonacci levels for signs of stabilization or reversal.
- Complement this analysis with other technical indicators (e.g., volume, momentum oscillators) to confirm blow-off top patterns or support strength.
- Consider macro and sector context to validate or adjust tactical views on support/resistance zones.
Note: This technical analysis provides probable support zones but does not guarantee outcomes. Market dynamics can change abruptly. Regular review and complementary analysis are advised.